Welcome to another edition of the Indicator Autopsy where we do an autopsy on an indicator and then give it a funeral. We open it up and then examine what makes it tick before we show you how it is possible to trade without using the indicator.
This week we are looking at the “Aroon” indicator. The Aroon was not built into the standard MT4 but may come included with more advanced charting software. However you can find a downloadable version of Aroon to include into your MT4 charting software if needed.
So let’s see what makes its gears turn and how it’s applied to Forex trading.
What does The Aroon Indicator do?
The Aroon indicator is an oscillator system that consists of two lines, Aroon up and Aroon down. Aroon only takes a single parameter, the Aroon period value. The period is the number candles used in the Aroon calculation.

Aroon up is the amount of time (on a percentage basis) that is remaining of the overall period after the distance between the current candle and the highest price has been considered. Aroon down is calculated in just the opposite manner, compared current price to the lowest price within the set time period.
How is it used?
This indicator is used to reveal the direction of the market, determine its strength and identify potential momentum exhaustion. The Aroon up and the Aroon down indicators fluctuate between zero and 100.
Strong trends are indicated by values between 70-100. An output of 100 would suggest that the current candle is printing the highest/lowest price within the set Aroon range, depending on if you are looking at the Aroon up or down outputs.
Weak market movement is indicated by values between 30-0. A value of 0 would mean that the very last candle in the Aroon period has the highest/lowest price, again depending if you’re looking at the up or down Aroon outputs.
For example, if the Aroon up indicator (blue line) is outputting 0, that would mean that the highest price is found on the candle that is located at the furthest end of the Aroon period.
The Autopsy
Like any indicator this one has a robust formula that makes it tick.
Let’s assume the Aroon period = A in the formula…
The formula for Aroon up is:(Candles since A high)/A) x 100
The formula for Aroon down is:(Candles Since A Low)/A) x 100
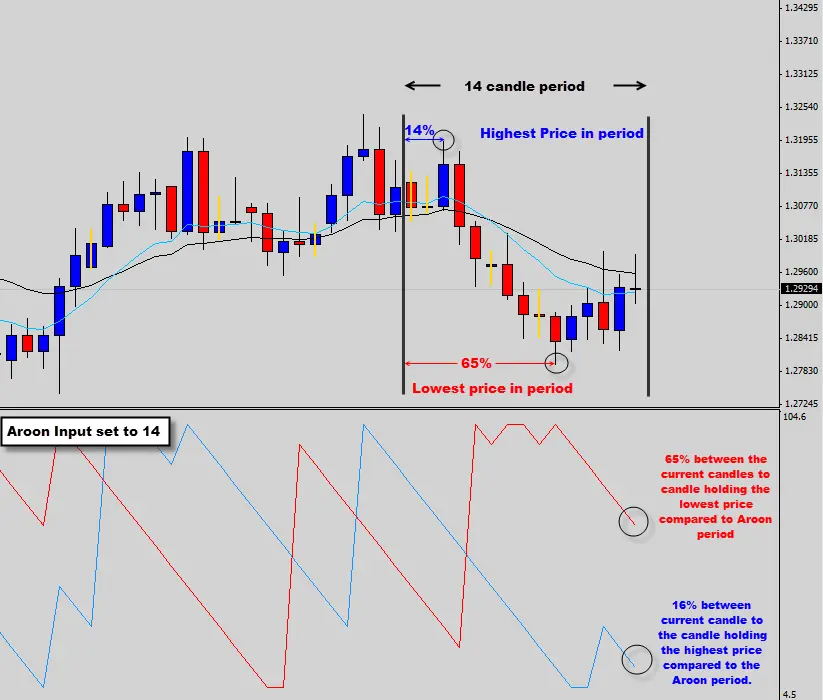
If the Aroon period was set to its default value of 14
Then let’s have a look at those formulas again when A = 14.
Aroon Up = (Candles since 14 candle high)/14) x 100
Aroon Down = (Candles since 14 candle Low)/14) x 100
Here is a visual demonstration on how the Aroon works on the charts…

While this indicator could be useful in some application and is one of the better indicators out there, we do have concerns with it that could affect trading performance.
Why we don’t use it.
This indicator only takes into consideration the candle highs and lows and does not factor in the closing price of the candle. This is a major problem because you could get an aggressive bearish signal, but the bearish signal might have printing the highest price in an up trending market. The Aroon won’t ‘see’ this bearish price action and will still output a high value. Let me show you an example…

Another issue that we have with the Aroon is that it encourages traders to ‘buy high’ and ‘sell low’. Because the Aroon will really only start outputting higher values when the market is breaking into new highs or pushing down into fresh lows.

We discourage this sort of trading because it can trap a trader into buying the top of a move or sell the bottom. There is no way to tell with the Aroon indicator if a reversal is around the corner…
While we understand that the Aroon indicator is for identifying trends and the momentum strength. Let’s just have a quick look what the Aroon does in less favorable conditions.

We know the Aaron doesn’t become useful until the market starts to trend, but take a close look at the chart above.
In hindsight the market looks like crap, but there are times when a trend looked like it was about to develop and the Aroon indicator was giving high outputs. Traders could have been trapped into bad positions, depending on how they trade the Aroon outputs.
The price action way…
First of all, identifying favorable trending conditions does not require an indicator. At first glance you should be able to tell if the market is trending up or down, or not trending at all.

To determine strength and stability we map out the ‘trend mean value’ using the 10 & 20 EMA. When these exponential moving averages are placed onto the chart, they map out the trend mean layer.
In our Price Action Protocol course we explain in detail how to use the mean value layer to determine
- Trend strength
- Trend momentum
- Price extremes
- Reversal Points
- Market hot spots
The 10 EMA and the 20 EMA also give us the advantage of smoothing out some of the noise on the charts, so we can see the trend pressure with much more clarity, providing less strain on the eyes. We are all about keeping trading as simple and effective as possible.
We discussed how the Aroon encourages ‘buying high’ and ‘selling low’ during trends, well it’s much more effective to ‘buy on weakness’ in an uptrend or ‘sell on strength’ during downtrends.
However we don’t blindly enter the market, we our candlestick patterns to signal us into a trade…

During this uptrend, you can see how ‘buying on weaknesses’ enabled us to position ourselves into trades with much better entry prices. That’s why we prefer to trade with price action, it’s so much more powerful than using the conventional indicator.
So there you have it; the Aroon indicator just had a funeral. May it rest in pieces!
If you would like to learn more about how we use price action to identify the best forex signals. Or, how we use the relationship between the mean value and relative price to give us a detailed analysis on the markets, then consider joining our Price Action War Room. You can find out more at the Price Action War Room Information Page.
See you at the next indicator funeral.