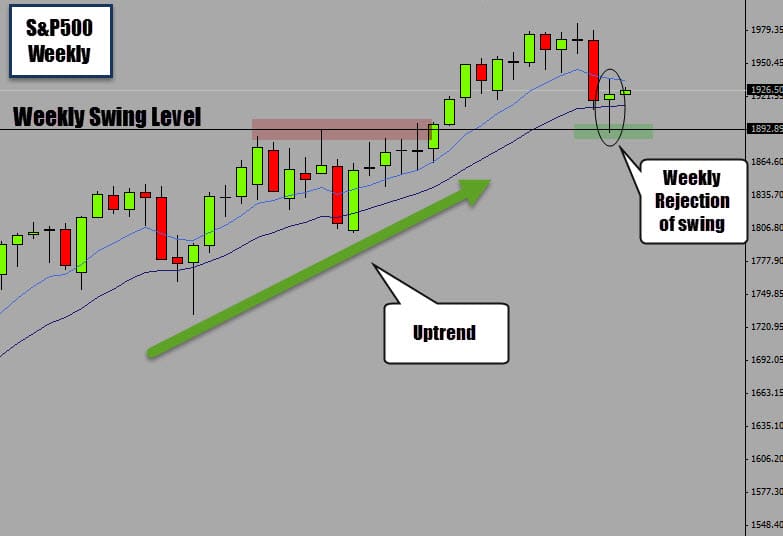
We’ve been talking about the price action on the big US stock index – the S&P. The S&P has been in a serious uptrend, it’s something traders should be watching with a close eye. Last week we did see the market fall down from fresh highs back into long term support. The weekly chart beautifully shows the uptrend in place here and the critical support level that we’re focused on. This area on the weekly chart is what we call a bullish ‘hot spot’ due to the fact the area is supported by the mean value and a critical swing level. The weekly candle did show bullish rejection of the hot spot, which give us price action traders a good reason to get long.
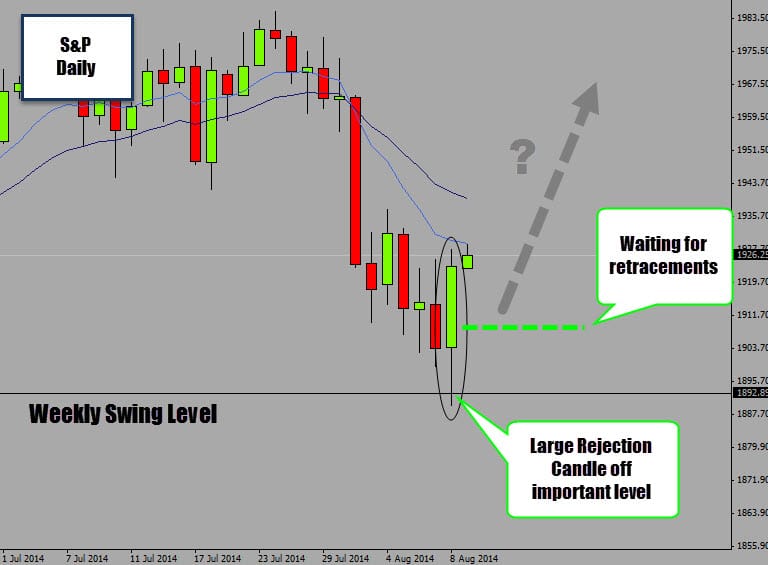
Zooming into the daily chart we can see a very strong bullish rejection candle that formed last Friday. This candle has an aggressive close up off it’s open price which gives this candle some strong bullish character. When the weekly and daily chart line up together it produces a very high probability price action setup. We’re waiting to catch any retracement that occurs on the daily chart to tighten up our stop loss and increase the reward potential of the trade.
The Train Leaves the Station without Me
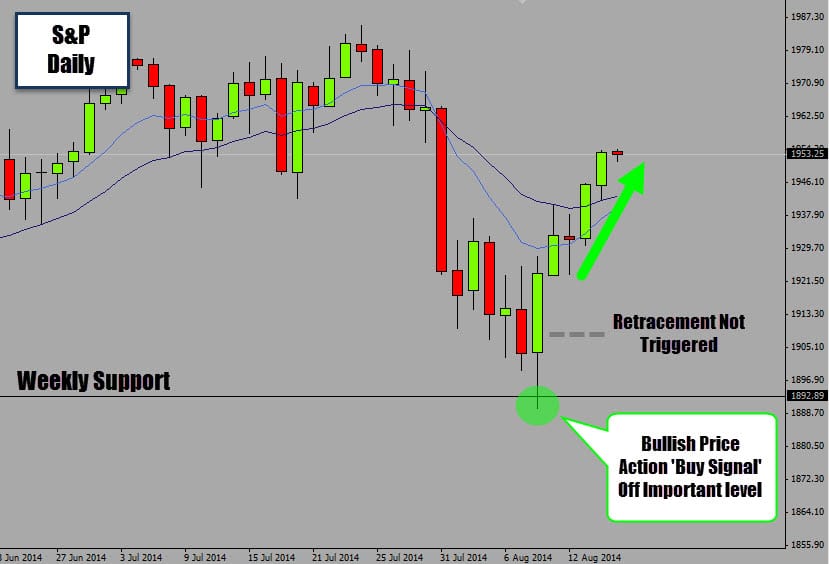
We recently covered a very nice price action trade setup on the S&P. We were looking at a fantastic buying opportunity on the daily chart, which was backed up by firm weekly chart analysis. The level marked on the chart was determined to be a very important turning point in the S&P market, and critical to the over all uptrend on the weekly chart. If this level didn’t hold, we could have seen some nasty bearish price action here.
Fortunately for the S&P bulls, the level held and we got a very strong bullish rejection candle here. I set a pending ‘buy on limit’ order at a retracment point. Unfortunately for me, my trade order wasn’t triggered and the setup took off without me. You’ve got to expect the unexpected in the Forex trading game and I’ve learned not to beat myself up over ‘missed’ or ‘lost’ opportunities like this. There will always be another trade around the corner.
If you would like to learn how to analyse the charts using price action only and spot excellent trade opportunities like the one demonstrated here, consider joining us in our Price Action War Room. It’s the perfect fit for traders who serious want to learn how to trade with price action.