The start of 2015 has been a really great start to the hear, price a price action – swing trader perspective. Especially in contrast to the shocking markets of early 2014. Hopefully the market continue moving with this steady volatility and make 2015 a year for the record books.
Today I just wanted to review some of the price action commentary of some popular markets that featured either here on the front blog, or in the war room ‘chart of the day’ commentary.
Let’s start with everyone’s favorite pair.
EURUSD Prints Sell Signal as Resistance is Respected
The markets have been very churned up this week, so traders should be extra vigilant with their trading decisions. It is hard to find good PA setups at the moment, and is probably going to be one of those ‘hurry up and wait’ weeks.
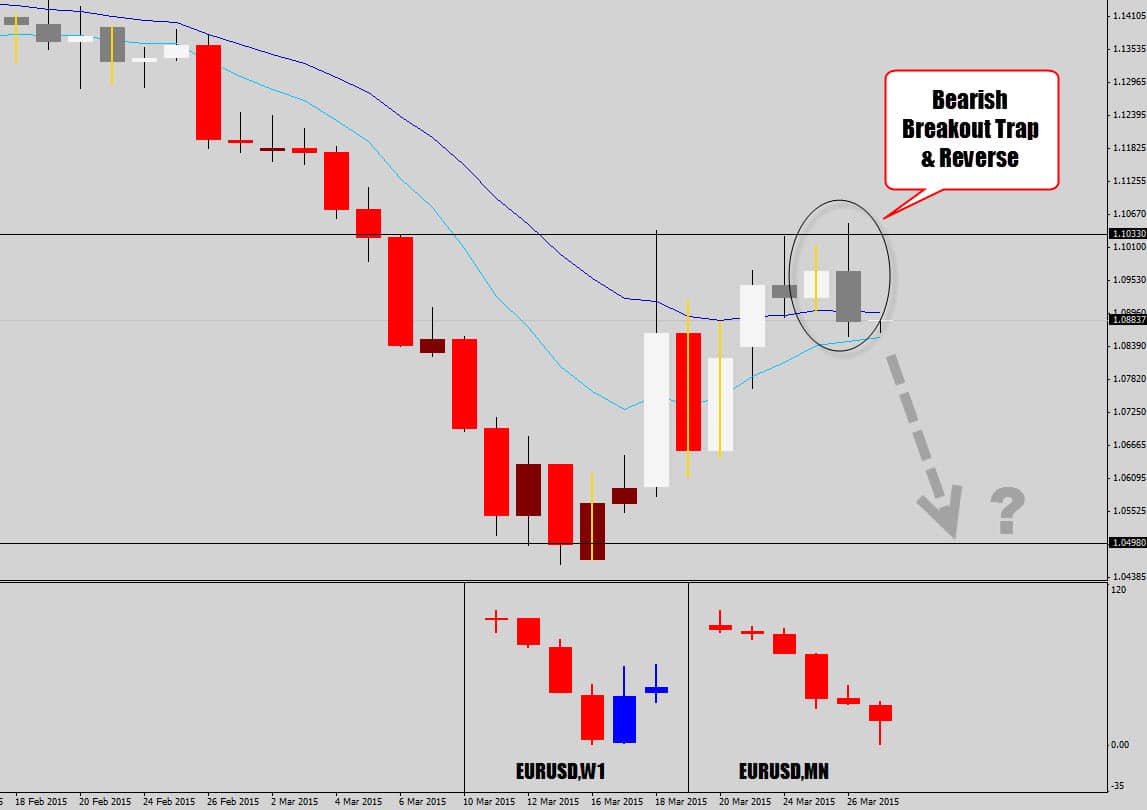
Looking at the EURUSD today – an inside day recently formed within some bullish market momentum. We’re sitting right under some resistance here, but because price is now closing on the bullish side of the mean, and the mean value was starting to vector upwards – we were looking at a potential bullish breakout.
Now the situation has changed just by one candle, with the daily chart is communicating a different picture.
It’s always tricky trying to anticipate price moves when the market is moving against a major trend. Is it a reversal, or just a temporary correction? I guess when in doubt stay out.
Resistance clearly held last session, there was a bearish breakout trap and reverse trade and essentially this is a sell signal. The candle closed as an Outside Day/Thick Body Rejection Candle.
If the setup plays out, we could be looking at a re-test of the recent weekly swing low. I almost looks like this market wants to start ranging.
One more Try at Resistance – Then we Drop
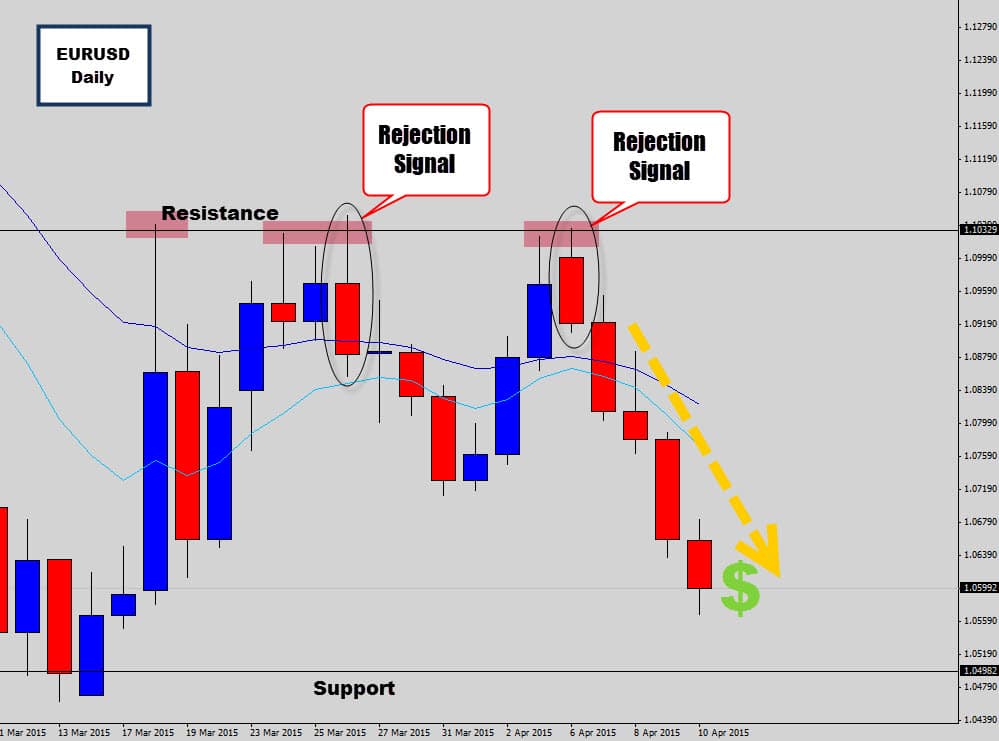
After the initial breakout trap & reverse trade, the market went back up and re-tested the resistance level. This probably would have freaked out a lot of traders short here, but for those who did exit, there was a second chance to get short again.
A second bearish rejection candle formed as the resistance was respected a second time. The second signal made our bearish bias here much stronger because both time the level was tested, we got a pretty heavy bearish response.
So the second signal pretty much took off the next day and continued selling off for the whole week. Even through we haven’t reached support yet, this trade has already offered some really nice pips for those to capitalized on the down move.
EURJPY Bears Defend Resistance Again – Bearish Rejection
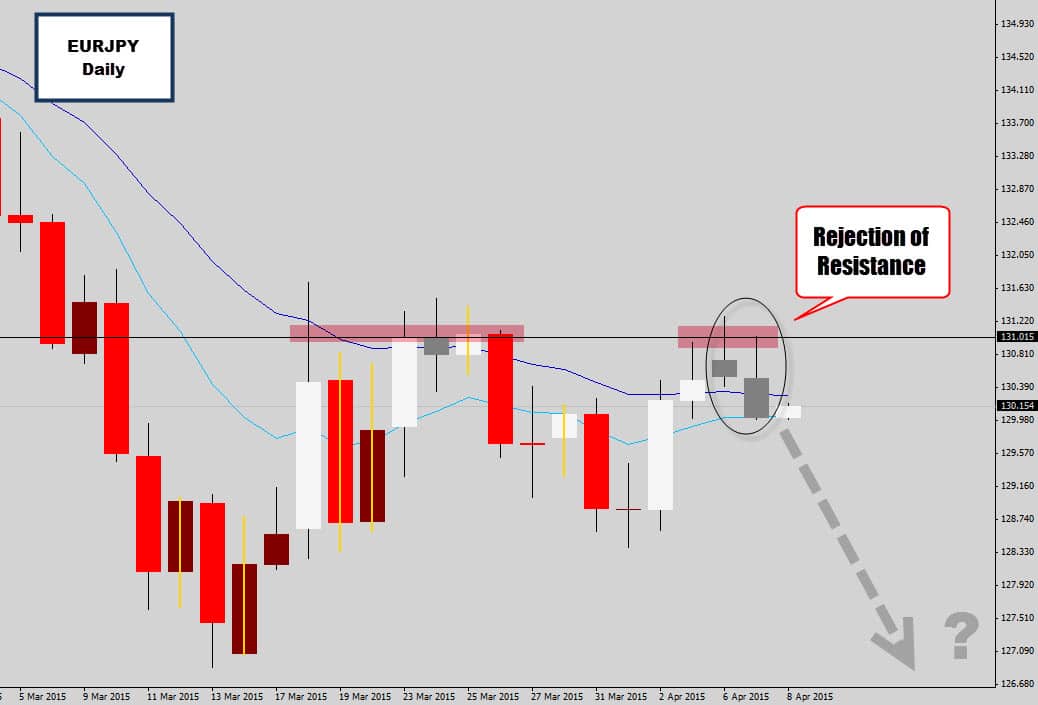
This setup featured in our War Room Chart of the Day commentary. We have a very similar situation to the previous EURUSD setup, where a resistance level is respected with some strong bearish price action signals.
The last 3 daily candles have upper wicks, and on lower time frames probably looks like a head and shoulders pattern. Last session’s candle was a ‘thick bodied’ bearish rejection candle – which gives the setup extra bearish ‘juice’ with the whole chart communicating likely near term bearish movement.
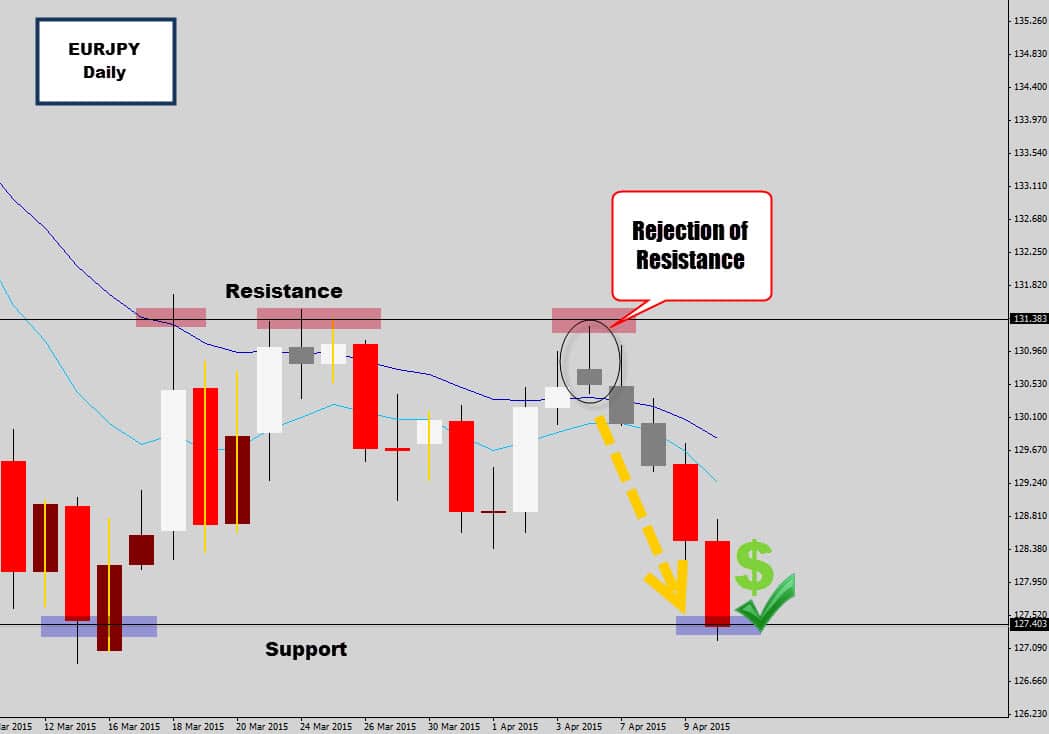
One week sell off Straight to Profit Target
This setup didn’t waste much time either, the following day even retraced during the early part of the session and offered retracement entries for those who like to really tighten up their stop loss for extra reward potential.
The sell off here was one of the best moves of the week actually. These type of powerful moves give traders ‘instant gratification’, meaning the trade triggers, moves into profit and stays in profit.
The sell off here continued all week, hitting major support on Friday – offering a good opportunity for price action swing traders to take profit on this one.
GBPNZD Produces a Mean Looking Swing Trade
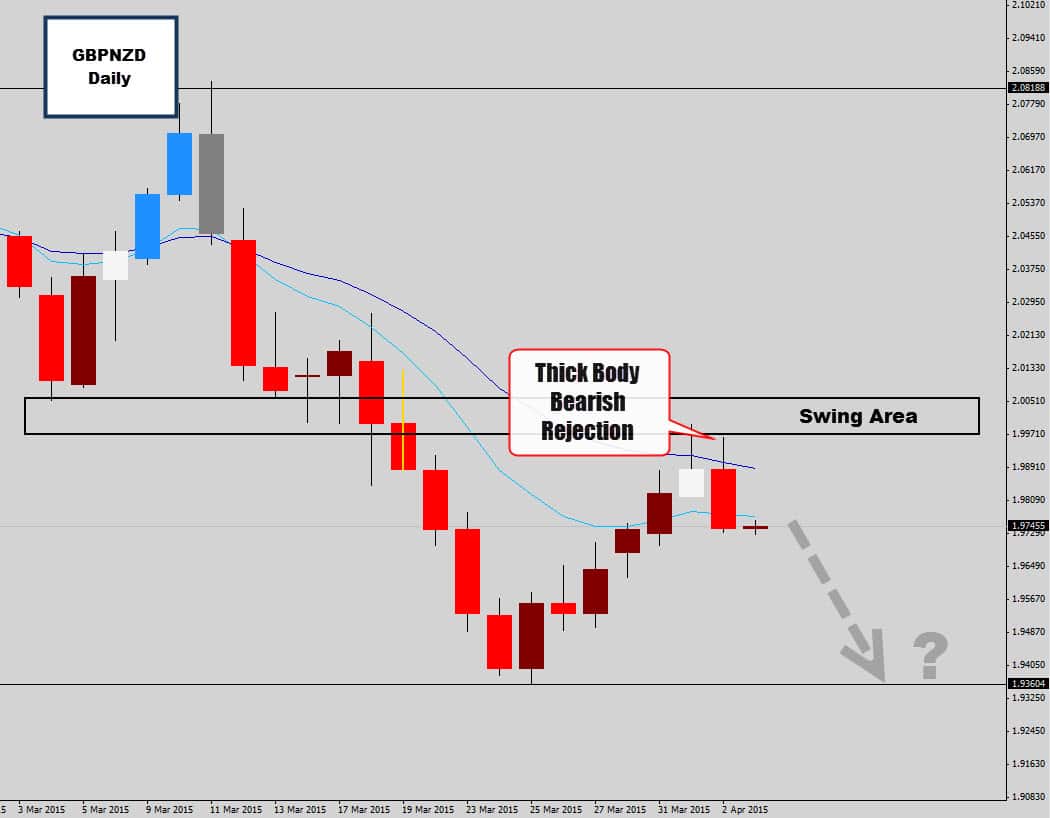
The markets were closed for the Easter weekend break, but we were eyeballing the GBPNZD which left us with a juicy price action swing trade setup. What we’re looking at is a ‘thick bodied’ bearish rejection candle which formed at a swing level ‘area’, and also off the mean value as well.
Generally these candles with thicker bodies are a more serious signal and we anticipated a move down from this setup, forecasting price to drop down to test the next critical support below.
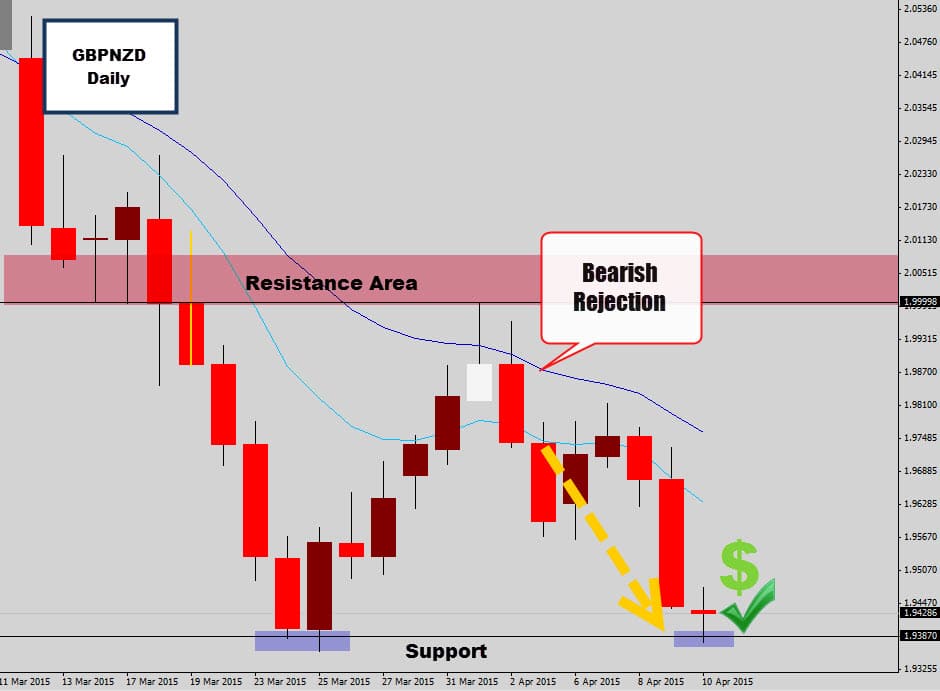
GBPNZD Swing trade Drops its Cargo and Falls to Support
The rejection candle setup here was a fast mover, and didn’t offer much in terms of retracement entries – therefore most of us didn’t catch this one because we didn’t want to carry a large stop loss.
But the setup still worked out as anticipated. These ‘thick body candles’ have a really good follow through rate – bearish rejection candles with such an aggressive close relative to the open like this one, generally will see some sort of bearish reaction.
Do you want to be able to identify setups like these?
I’ve been a Forex trader for 7 years since my early 20’s and I am continuously amazed each time I see these setups, and see them roll out like this in a predicable way again and again.
If the market wants to move, or breakout, it will nearly always drop a ‘clue’ in the form of a price action signal and those who know how to identify trading opportunities straight off a price chart can anticipate these moves before they occur.
If you would like to become a price action trader, and become an expert and price action swing trading like I’ve highlighted here today – check out our War Room Membership for serious traders.
Until next time – All the best on the charts next week.
2 Comments...
Hong
Currently the market (EU,EJ) form a bullish trend. Which mean it is possible that it will go back to the start point (Resistance area)? and start selling again? or it just a short term reverse?Should we go for buy in short run?
Error happened.
Replying to: Hong
TheForexGuyAuthor
That’s a fair outlook to have, if we see some sell signals at that resistance level again, we can consider building a short trade off it. Just have to wait and see.
Hong
Currently the market (EU,EJ) form a bullish trend. Which mean it is possible that it will go back to the start point (Resistance area)? and start selling again? or it just a short term reverse?Should we go for buy in short run?
Replying to: Hong
TheForexGuyAuthor
That’s a fair outlook to have, if we see some sell signals at that resistance level again, we can consider building a short trade off it. Just have to wait and see.