The Stochastic Oscillator indicator is available on every charting platform and is a very old indicator developed in the 1950’s by a technical analyst named George Lane. Because Stochastics is placed in front of nearly every single trader, it gets used quite a lot, but with how much success? Such widespread availability and popularity means it must be good, right? Well let’s take a closer look…
What Does The Stochastic Indicator Do?
The Stochastic falls under a class of indicators called oscillators – essentially they yo-yo back and forth between an upper and lower limit.
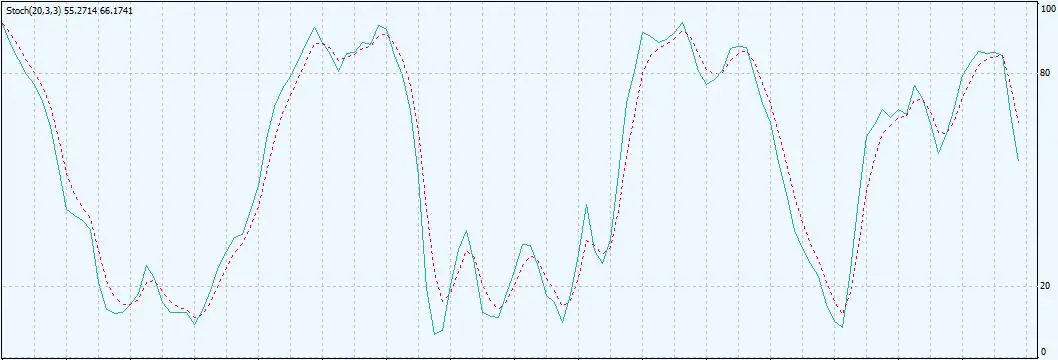
The maximum value of the Stochastic indicator is 100% and the minimum value is 0%.
The 2 indicator lines bouncing up and down are called %K and %D. The blue line is the main line – this is called %K. The red dotted line that lags behind is called %D.

There are 2 main ways to interpret and use the Stochastic indicator.
Overbought and Oversold areas

One idea is to look to short the market when the %K line nears the upper limit (traditionally the overbought region is between 80% – 100%). Similarly, when the %K line nears the lower limit (between 0% – 20%), we look for longs because the market is considered oversold.
%K and %D crossovers

Another idea is to go long when the %K line crosses above the %D line and to go short when the %K line crosses below the %D line.
How Does Stochastic Work?
Let’s try and understand what the %K line actually means. Effectively it gives a visual representation of the current price compared to the recent market high and low.
By default, the %K line uses data from the last 20 candles in its calculations and then smoothes out the results with a 3-period (known as the “slow” Stochastic line) moving average.
The %D line is a 3-period moving average of the smoothed %K values (ie. A moving average of a moving average!).
All these values are fully customizable as you can see below:

Let’s examine the %K calculation in detail to see how it compares current price to the recent market high and low.
%K = (Current Close – Lowest Low)/(Highest High – Lowest Low) * 100
Lowest Low = lowest low for the look-back period (default 20 period)
Highest High = highest high for the look-back period (default 20 period)
(Note: %K is multiplied by 100 to turn it into a percentage, it is then smoothed out using a 3 period moving average)
%D = 3-period moving average of %K
(%D is a moving average of the smoothed %K, so it is a double smoothed %K)
This is easily understood using some visuals:

If price closes near the low of the last 20 period range, then the %K line will be near 0% (similarly if price closes near the high of the last 20 period range, then the %K line will be near 100%).

If price closes near the middle of the last 20 period range, then the %K line will be near 50%.
The Autopsy
It is important to note that you can’t take a trade at the exact moment that the Stochastic %K and %D lines crossover, you actually have to wait for the close of the following bar to confirm that there has been a crossover signal. So the earliest time you could take a trade is on the open of the 2nd bar after the Stochastic crossover.

Show this model example to any new trader and they will think that they have found the holy grail! The Stochastic indicator is capturing the highs and lows of the market perfectly every time, generating profitable signals.
But wait! Before you go adding yet another indicator to your charts let’s look at the problems with the Stochastic.
Why We Don’t Like It
Like all oscillator indicators, the Stochastic will remain overbought in a strong uptrend and oversold in a strong downtrend, generating many false counter-trend signals.

Looking at the price chart it is obvious that price is in an uptrend but looking at just the Stochastic indicator it would appear that price is trending down??!

This is generally how a trader will feel after letting the Stochastic indicator guide them through trending conditions…

Looking at the price chart it is obvious that price is trending down but the Stochastic indicator is oversold all the way down, generating bad buy signals.
Another problem with the Stochastic indicator is that it can struggle to correctly identify the high and low of a range.
Looking at this daily chart of CAD/JPY it is clear to the naked eye that price is in an extended consolidation and I have marked the important support (true range low) and resistance (true range high) levels being respected. Every price action trader knows that trying to trade inside the consolidation is a bad idea because price is likely to whipsaw up and down erratically.

Unfortunately, the Stochastic indicator doesn’t have a brain – it can only look a fixed number of periods backwards. In this example, the Stochastic indicator can’t look back far enough to see where the key support and resistance levels are, generating low probability crossover signals inside the range.
The Price Action Way
Why on earth do you need a lagging indicator to tell you where support and resistance is when you can just use your eyes and do a faster, more accurate job?
By observing the distance of price from the mean value we can also gauge quickly whether the market price is considered too expensive (overbought) or too cheap (oversold).

More information is not necessarily better when it comes to trading. The more unnecessary clutter you have on your charts the more likely you are to overload your brain and end up with “analysis paralysis”.
In this article we have examined the Stochastic indicator in detail and seen how it attempts to identify turning points in the market. We have highlighted how ineffective it is in strongly trending markets, constantly generating false counter-trend signals. We have also shown how using your eyes to draw simple horizontal support and resistance lines can be more effective than using the Stochastic indicator to highlight overbought and oversold areas. Finally, we have seen how laggy this indicator is, compared to price action, hence we can safely consign the Stochastic indicator to the bin!
This is just another case where the classic indicators which were formulated so many years ago simply don’t work in today’s markets. In this day and age you’ve got to be able to make more logical trading decisions, not relying on indicators that have past their expiry date.
If you would like to learn how to become a master chart reader and be able to trade without using any external indicators like Stochastics, then price action trading is going to be the best fit for you. If you’re really serious about learning a professional price action trading system, you may be interested in becoming one of our war room members.
toi do
If you use it on different time frames it can filter noise well for you
Ottie
I agree with you about stochastics. What do you mean by war room member?
Joe
Personally I like it. I’ve used it for the past 6+ years I’ve been trading… I just find you have to know when to ignore it and when to use it. I don’t make it my mission to trade off of this indicator or any indicator of such but I do like the Stochastic as a filter from time to time.
Clive Stevens
Hi Dale
I have just got to the point where I have nearly blown my account by been totally focused on the Stochastic indicator. Just yesterday I queried whether this indicator really works. What you described above is EXACTLY what has been happening to me. I decided yesterday NOT to use indicators. Finding your forum and the information you have shared has been extremely valuable. Maybe I can save my accounts now and not get “blown out”. It has taken me 4 years to get to this point.
Thank you
Ottie
I’m not sure I got it. How can you tell it’s a top or bottom? Isn’t it just a guess?
Johnfaith
yes, indeed, it is a lagging indicator, but skeptic traders have being using it to pick waiting trades,.To me I prefer the price action concept as that takes you into the market with accuracy before the stochastic start saying anything in lagg
Best
Truly I found this teaching highly accurate. I appreciate your teachings, your wisdom and mostly kind love in letting us know these things. To be honest. I never lose trade since three days now. and I hv made $1,700 in the said three days. but unfortunately I’m just one practice account. I lost so much money some yrs ago and had no choice than to quit. but am here again to make it and with the help of price action through the forexguy. I can see a lot of improvement on my trading. I love you the forexguy.
Steve Epperson
I don’t like it because I have trouble saying “stochastic.” Not even sure I can spell it…