It’s that time again where we rip open another indicator and see how it ticks and try to convince you that they don’t work. It’s time to shake off the mentality that an indicator can show you reliable entry and exit signals.
This time we have an indicator that is so boring it’s actually interesting.
The Commodity Channel Index was developed by Donald Lambert and featured in the Commodities magazine back in 1980, yes it has been around for a while. Although this indicator was developed for the commodity markets, traders now use it in all financial instruments, including Forex trading.
The Commodity Channel Index (CCI) indicator is a popular indicator which you will find included in most charting packages and I personally know a few traders that use this to find divergence in the market and trade it.
What does THE Commodity Channel Index do?
The CCI is an oscillator class indicator that prints a line graph operating between a scale of +100 & -100. The CCI can print outside of these ranges; in strong markets I’ve seen the CCI print values over +400.
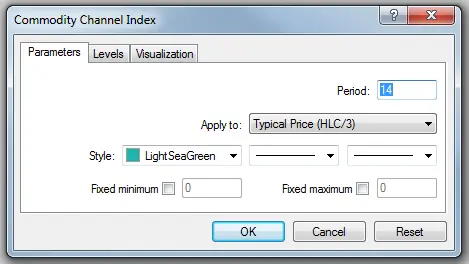
When the user attaches the CCI to their chart that need to input in the period value, the default is 14.
How does The Commodity Channel Index work?
Here is the formula that is used to calculate the CCI value…
CCI = (Typical Price – Period MA) / (0.015 x D)
This equation basically tells us that the Commodity Channel Index grabs the typical price value (Candle High x Low x Close / 3) and then works out the difference between the moving average period value set by the user. This value is further divided by 0.015 x D (where D is mean deviation).
The bottom line is the Commodity Channel Index is another one of those indicators using a moving average in its core calculation. This raises a yellow flag straight away because moving averages lag and that is going to directly affect the output of the CCI by producing a lagging value.
The theory behind the use of the Commodity Channel Index is so trader can clearly see when the market is ‘overbought’ and ‘oversold’.
The general idea is to get into the market when the price hits the high range or a low range. It reveals where the market will be exhausted and is likely to reverse.
This indicator is for those who think newton’s law can be used for Forex trading. What goes up certainly comes down, but if you have a 3 year uptrend you’re going to wait until the sun dries up for a down trend to happen.
The CCI Indicator Autopsy
I hunted for a period in the chart where the actually Commodity Channel Index actually performs the way it was designed to, it was not an easy find…

In the example above I managed to find a situation on the chart where the conditions where oscillating perfectly for the Commodity Channel Index to start working to a degree of effectiveness.
When the Commodity Channel Index moved into the overbought range (>+100) the market soon reversed and sold off. When the market dived into the oversold range (<-100) we soon seen the market find some footing and starting climbing higher.
Even using the ideal scenario above, you can see that the CCI can push past the +100 & -100 boundaries and there is no way to tell when it will stop. This unreliability makes it hard for the trader to find a logical place to position their stop loss.

Why we don’t like it
It is as obvious as a Chuck Norris movie ending. The bottom line here is the indicator really just imitates the overall chart movement. It is a watered down “mini me” version of the main chart.
Why would you bother using a smaller version of the main chart and rely on the Commodity Channel Index scale to tell you when the trend is tired or not.
Not to mention that the CCI doesn’t really perform that well in trending conditions…

Trending conditions is where the money is at, if the Commodity Channel Index doesn’t work when the market is trending then why would you even attach it to your chart, so it can tell you the market is ‘oversold’ the whole way up?
Some traders enter their trade in the direction of the 0 line break. If the line breaks through the 0 from below, it’s a buy. If it breaks lower over the 0 it’s a sell. Many hold on until it strikes bottom before they get out or they wait until it strikes the top.
The issue with using the 0 line as a trade trigger is the epic amount of false signals that are triggered as the Commodity Channel Index can continuously vibrate around the 0 level.

The example shows the CCI cutting through the 0 level, if you traded ever cross over here the trade either fails straight away, or climbs into negligible profits before caving in on itself.
Surely one day you will catch that 0 crossover that will see the market produce an epic move, but the real question is will you have any capital left by then?
Traders also use the peaks and troughs in the CCI graph to spot divergence with the highs and lows of the chart. Personally I’ve rarely seen a divergence play out the way it’s supposed to, especially during trending conditions.
The price action way
So we’ve justified a funeral for the Commodity Channel Index. Let’s show you how it’s done with price action.
We map the price mean value on our charts using two exponential moving averages, the 10 & 20 EMAs. We don’t use the EMAs for trading signals, just as the mean reference.
We can identify extreme conditions in the market, just like when the Commodity Channel Index moves into oversold or overbought conditions by judging the distance between price and the mean value.

When there is a large gap between the mean and price, there is a strong chance of a reversal or correctional move in the market.
However this isn’t enough to justify opening a position, that’s why we add confluence to the situation by waiting for a price action signal.

The Commodity Channel Index indicator is nothing more than an inaccurate way for determining extreme price levels. The information is derived from the data we (Price action traders) use to trade on. So why not cut out the middleman and trade price action directly.
Price Action is more accurate, reliable and doesn’t lag. If you would like to improve your trading with price action then you can check out our Price Action Protocol trading course.
In the course we will teach you how to read a plain price chart and how to utilize the mean value to pinpoint key areas on the chart to identify high probability, low risk trades.
Peter Jr
Hi Dale, What the platform for this setting? MT4?
MP
Rubbish article, CCI is very very powerful when used with other indicators such as Stochastic.
Replying to: MP
Dale WoodsAuthor
Then why are you reading tutorials on the CCI?