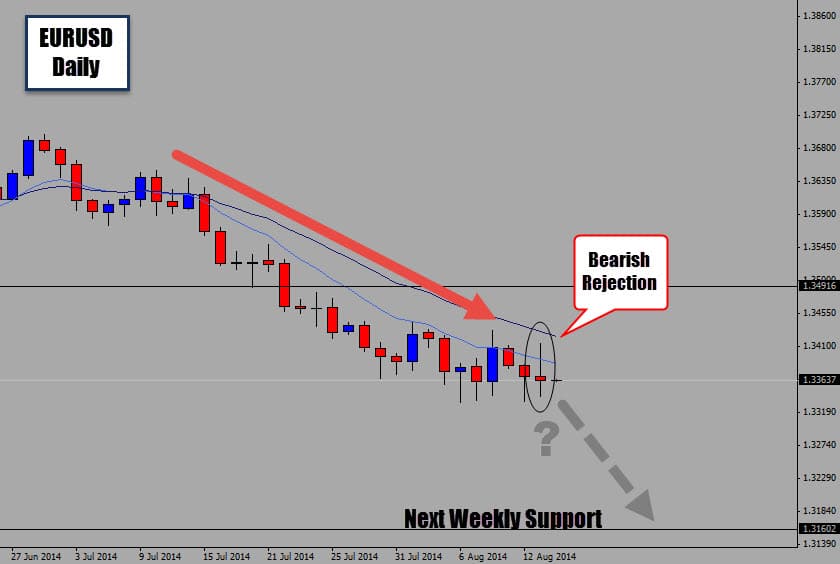
Looking back at the EURUSD again, it’s one of the ‘hot charts’ at the moment with this awesome downtrend momentum we’ve got going on the daily chart. Most of the other markets have stalled in terms of movement, always focusing on the moving pairs.
The Inside Day we pointed out at the start of the week did trigger a bearish trade. Depending on how tight your stop loss was, you may be been taken out on last sessions’s attempt to move higher (news spike). The bullish noise created by the news caused price to move up into the mean value area. At the end of the day, the rally was denied and the daily candle closed as a bearish rejection candle. It’s a pretty straight forward setup, a bearish signal aligned with a bearish trend. Nothing complicated, just the way we like it.
On a longer term point of view, the EURUSD market looks like it’s heading down to test the weekly support level marked on the chart.
EURUSD Breaks Down Lower!
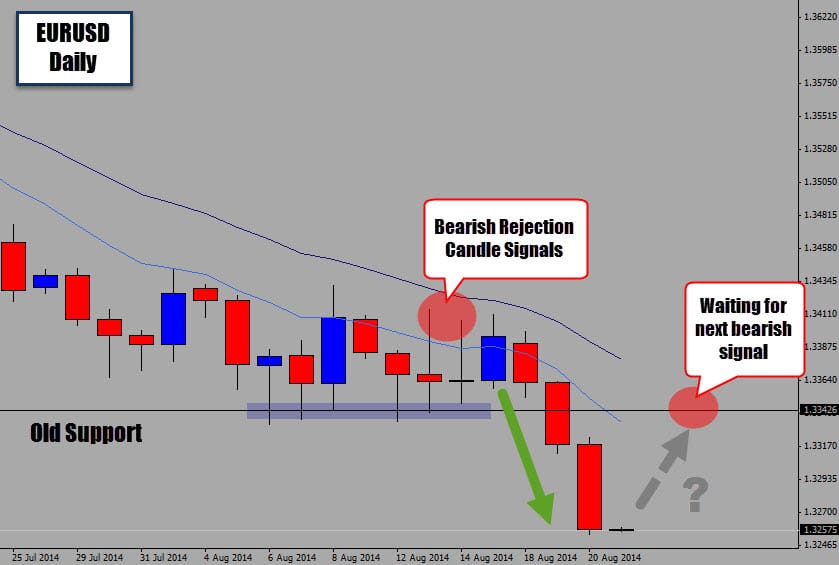
The bearish price action setup we covered on the EURUSD daily chart has played out nicely for us. The market did stall before moving down, producing a second bearish rejection candle signal. This gave price action traders another opportunity to consider getting short in case they missed the first signal.
The market has sold off nicely and broken through recently lows which we are now looking to act as new resistance. This is the perfect area for another bearish price action signal to develop, so keep your eyes on this level.
Well done to those traders who caught this bearish move. If you would like to learn more about trading with price action and trading using simple, indicator free chart analysis, take a look at our Price Action War Room.