Price action methodologies and swing trading already provide a really powerful way to trade the market – but when you leverage the combo with ‘mean value analysis’ you can really start to ‘see’ a lot more.
The word ‘mean’ is another word for ‘average’. Averaging is heavily used, maybe even over used in the financial markets – including the stock market.
However, it can be an important tool when used properly. Scientists, mathematicians, and data analysts use the power of averaging in clinical studies, predictive analysis and other type of ‘data churning’ forecasting applications.
In today’s article, I want to show you how the power of simple averaging can be applied to your trading in the Forex market, and as a result render most common mainstream indicators useless.
The Wisdom of Crowds

For example, you know those guessing competitions held at local fairs where people are asked to estimate how many jelly beans are inside a jar?
Most people will be way off with their guesses – some as much as 100x over or under the actually quantity. In fact, out of 160 people hypothetical people, only 4 would come close to the actual value.
Interestingly enough, although no one will usually get the correct answer, ‘everyone’ (as a group) will come pretty close.
The typical scenario will show that when the collected guesses were averaged together, the number was something like 4514.98 when the amount of jelly beans in the jar was 4510.
This means the collected data from everyone was able to accurately determine how many jelly beans were in the jar within just 5 jelly beans, that’s a 0.11% margin of error.
That’s pretty amazing, and really does show the power of averaging.
A YouTube channel did the same jelly bean experiment by letting people input their guesses in the comments.
When the results were tallied and averaged, the ‘mean guess’ was within 4% of the actual value. Generally what happens is people who over guess are canceled out by people who under guess – this is math naturally ‘filtering’ out bad guesses.
What this shows is you can gather the collected thoughts of everyone as a data input, average out those results to get something that is uncannily close to actual value.
Checkpoint
Probabilities and Averaging should be the Backbone of Your Risk Management
Many Forex traders have difficulty switching over to thinking in terms of probabilities.
Unfortunately a lot of people have their heads filled with misinformation, contradictions and paradoxes. Therefore most newbies rank money management and capital preservation much lower than experienced traders do.
But the bottom line is – trading is a game of math. You must understand probabilities and statistics, and aim to keep on the right side of the numbers by exploiting your edge in order to succeed.
My edge, and what I teach other traders to do, is to exploit reoccurring price patterns that continue to repeat themselves in the same fashion.
Remember, there are a given number of market participants in the market at any time – and they are all doing the same thing over and over again to try and make money. That includes large ‘smart money’, like investment funds, and commercial companies who have the biggest volume in the market.
This repeated behavior creates the price action signals we recognize and use to forecast price movements. These buy or sell signals on average will behave the same way as they have in the past, producing results we can capitalize on..
To further leverage the power of averaging, we also apply ‘positive risk reward’ risk management to our trades, so that the ‘average’ trade will always turn over a profit – even if most of them are getting stopped out. For example:
Understanding Risk Reward Ratios.
When you apply a 1:3 risk to reward ratio to your trades, you can lose 75% of your trades on average to break even, or lose 66% to make money.
To put that another way, you only have to win 1/4 trades to break even, or 1/3 trades to make money.
When you look at your most recent trades, you might not see these numbers – but if you keep applying this principle, the numbers will eventually ‘smooth out’ and represent what I am talking about here.
For example; You might have 4 x 1:3 trades hit target. Which is a total return of 12R. Afterwards you may suffer a draw down period of 5 losing trades – but it won’t really be ‘draw down’ so to speak, because you’re still going to be up 7R.
If I can represent this in the reverse order, the losses may occur first – meaning you strike a -5R result from a losing streak. But if the next 4 trades are winners, the whole situation is turned around and you’re going to be up to +7R.
This is somewhat expected, because the market moves through good and bad money making conditions for any given system, and losing and winning trades will tend to group up as the market cycles through it’s various states.
Start using the averaging power of positive risk reward, stick with your guns, and you will eventually see positive results. This is provided you have a positive edge in your trading system, like trading with price action.
Checkpoint
How Most Common Indicators Work
You may have already done your homework, or be in the middle of the experimenting/exploration phase.
Completely understandable – sometimes you just need to explore them to eliminate any lingering doubt in your mind about what you might be missing out on. This way you know exactly what indicators are like, and can decide quickly from your own experience if they are for you or not.
Most traders will ‘zero in’ on the arsenal of indicators readily available to us in the popular charting platforms – these indicators also happen to be the ones that get spoken about a lot on major financial sites and forums.
When you apply indicators to your charts, they generally output their data in the format of either a line graph, or histogram graph. The indicator is like a ‘black box’ performing the hard work internally, outputting the result conveniently on your charts.
Here’s the issue: traders will be so focused on trying to find an edge to exploit the indicator’s output to try derive good buy or sell signals, but won’t actually explore how the indicator works internally, or develop a true understanding of the tools they’re dealing with.
In my indicator autopsy segment, I do exactly this. I ‘cut open’ the indicators and explain how they actually work on the inside. Would you be shocked if I told you that most common indicators are just a combination of price action data and averaging math?
Well, it’s true. Indicators like the stochastic, ADX and CCI use the high, low and close price of candles and pump them through averaging formulas. The ADX actually recycles its data though multiple layers of averaging.
The ADX is designed to quantify a trend by giving it a numeric value. The higher the number the stronger the trend…
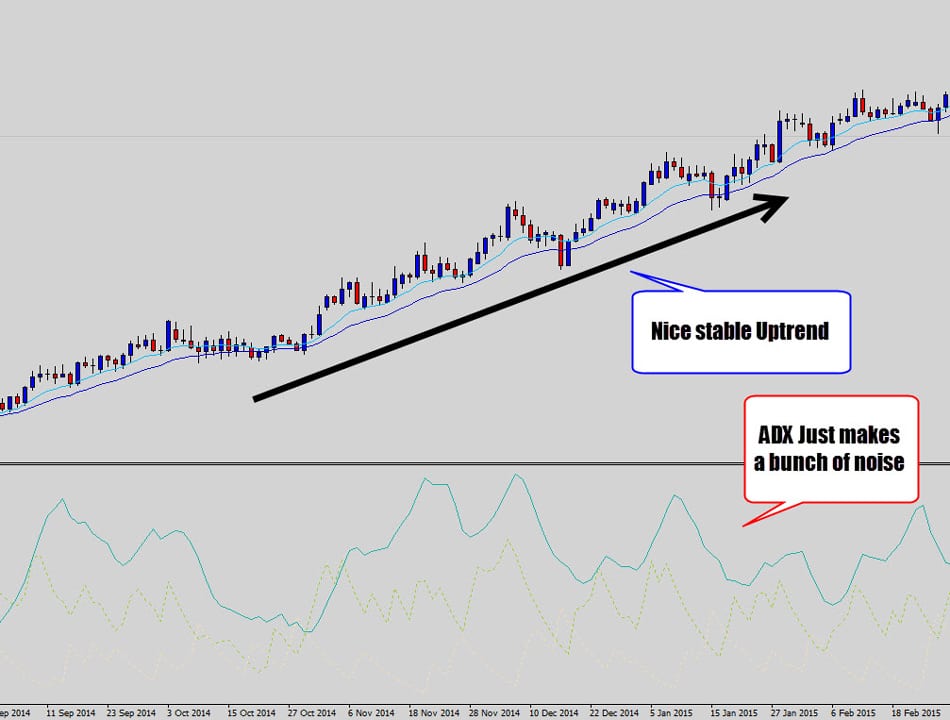
You can see on the USDSGD, we had this beautiful trend which the mean value highlights nicely (more on that in a moment) – but the ADX just pumps out a really screwed up line graph that doesn’t seem to correlate to the trend strength, or stability what so ever.
There are some custom indicators floating around that are actually multiple indicators merged into one unit, in an attempt to create some hybrid super indicator.
This is why indicators are known to have such horrible lagging nature, some are obviously worse than others – because every time you average out data, the final output becomes much slower to respond to actual price movement.
When you compare what’s going on inside most indicators, they are actually just a play on price action data thrown though some averaging math – there really isn’t a great deal between them, the same kind of data is just displayed in different ways. This may be an advantage for some, but the majority of us will get frustrated with the performance of common and custom built indicators.
Granted, some indicators may work well under specific conditions for short bursts, mainly strong trending markets – but will screw the trader by providing a lot of bad, low quality buy & sell signals during conditions that are outside the indicator’s preferred optimal market behavior, which could be as much as 80% of the time.
Checkpoint
Introducing Mean Value Analysis
Long story short, this is how I discovered most indicators are just glorified moving averages, and because I like to keep things simple I decided to just apply a single moving average to my charts.
The idea was reinforced by the industry, as I noticed that a lot other traders also used moving averages on their charts – particularly with the ’20 exponential moving average’.
After spending much screen time using price action with the 20 EMA, I also added a second EMA which was just half the value, to create one ‘fast’ and one ‘slow’ EMA on my chart template.
To this day I still use the same setup – the 10 & 20 EMAs
This combination was responsive enough to price changes, but not too sensitive that it would create a lot of bogus analysis.
The 20 EMA is what I like to think of as the ‘baseline’ mean, and the 10 EMA is a ‘helper’ to assist in identifying other aspects of a trending market’s anatomy.
This was the inception of mean value analysis for me – the study of price relative to its ‘average’ value. I use mean value analysis to help determine a lot of things on a price chart which you might not have realized was possible:
- Trend Direction
- Trend Strength & Momentum
- Market Stability
- Signs of Trend Climax / Exhaustion
- Ideal Buying and Selling Hot Spots
- Over Extension in Price / Mean Reversion Trade Opportunities.
Here are some examples to give you an idea on how the mean value anatomy can be used to do some simple market analysis.
The chart below shows a very unstable market, look at how the mean value reacts to these conditions…
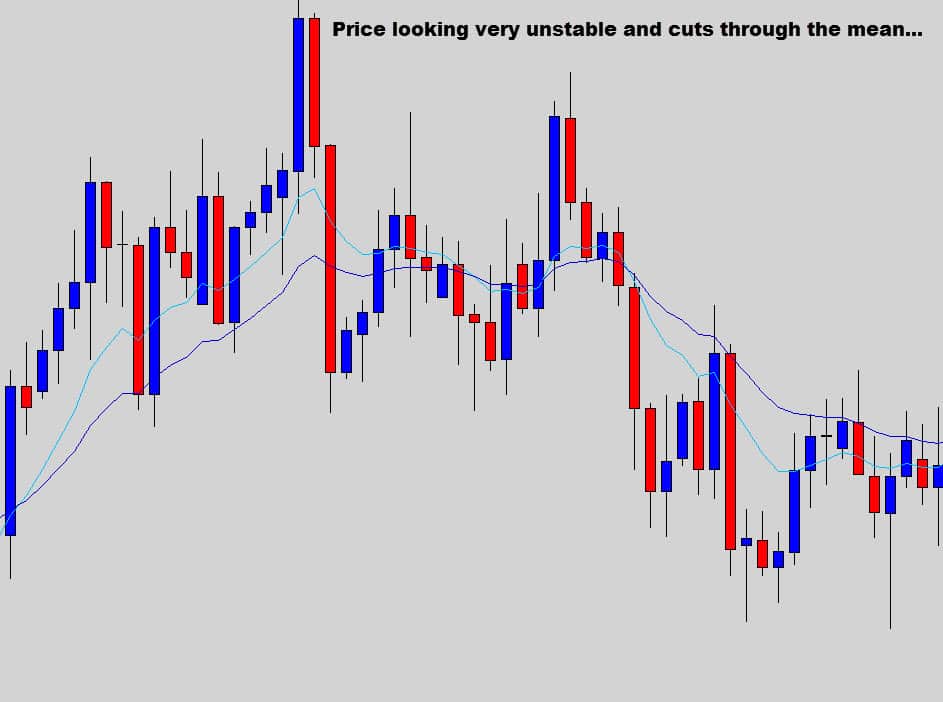
Notice how the mean value gets all twisted up and starts to look like spaghetti. There is no respect of the mean value at all here and we can see price just cuts through as if it wasn’t even there.
This is typical of unstable markets, when price consolidates, has no direction or is just moving sideways – the mean value gets all screwed up and basically is rendered useless.
This occurs due to the lack of direction, and momentum in the market, and are hard conditions to trade under. Bottom line – the mean value analysis warns us of dangerous conditions here.
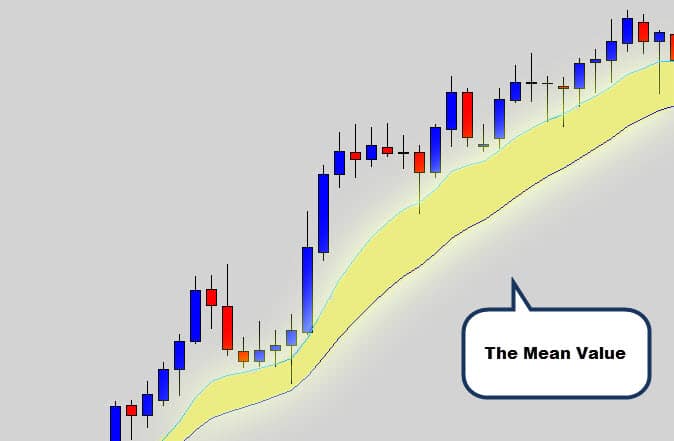
When the market starts moving and producing move stable, friendly, ideal trending conditions – you will see how it takes a completely different shape.

Notice how the market is in a nice downtrend, and the mean value comes into good form with the market momentum. Price is respecting the trend mean as dynamic resistance which is a good sign of trend stability.
The mean value’s averaging properties help the trader quickly cut through the noise, presenting a simple overall ‘summary’ of the market that you can use to quickly gauge conditions at first glance, and assist you in making smart trading decisions.
But of course mean value analysis isn’t the only aspect that makes up a good trade signal…
Mean value analysis, price action and swing trading work synergistically with one another to create a very powerful trading methodology that will basically transform you into the master chart reader. If you also throw in the positive geared money management, split money management, and pyramid money management models – you have the core foundation of our Price Action Protocol course.
The course comes bundled with our Trader’s War Room membership, and will teach you all you need to know about mean value analysis and all the other concepts mentioned in today’s article, to transform you into a successful trader.
As you can see averaging plays a big role in a lot of areas (not just Forex), but the whole Financial sector’s umbrella. Price movements can be chaotic and averaging is just a convenient and simple way to cut through the noise and provide nice smoothed out data.
I hope you found today’s article insightful and not a painful trip back to high school math class.
Good hunting, and Best of luck on the charts this week!
daus
EMA should be apply to close or smoothed..?
Joe
Thanks for this info. I like the idea of keeping it simple and plan to give this a closer look. In regards to the ema’s…. I noticed the comment where you confirmed it’s applied to close. For the MA method… do you use simple, exponential, smoothed or weighted?
Awieputra
Which pair u prefer boss.?
…
I’m newbie trader..trying to be a swinger trader as well..
Tq for sharing
shamas
Hi
Very very informative and helpful article
My question is relating to the slope and divergence of averge.
Does it matter or not?
And how can we use in our trading setup and what is the meaning of divergence and slop of average in forex market
Thanks
Shamas
Richard
Why not use 20/50 EMA which is also widely used for trend trading?
Replying to: Richard
TheForexGuyAuthor
I find the 10/20 to work best with my swing trading tactics.
farzad
Your view about mean value is so practical.
thanks for all.
Ben D'limi
Thanks Dale, I use 8 and 21 ema, I’ll try 10 /20 , maybe not too much difference!
cheers,
Brou Ebo
Thank you the forex guy for this release. I do like what you said about risk reward ratio . I think this should be a good start for newbies. So even we make some lost we are still in profit. Thnx
Shaikh
Thanking you Forex Guy.
I am going to use 20 EMA and 10 EMA in my Basic 1Hour time frame.
I will let you know how it is working.
Kind Regards.
Replying to: Shaikh
TheForexGuyAuthor
You can always try, but I use the 10/20 combo on the daily and weekly time frames.
sentosazr
great idea hope you give more tactics