The pound has just been through a nice steady up trend which pushed the pound above and beyond the $1.7000 level that it hasn’t seen in years. Now it seems the GBPUSD has made a turn toward the downside after price stalled during the last few weeks of trading.
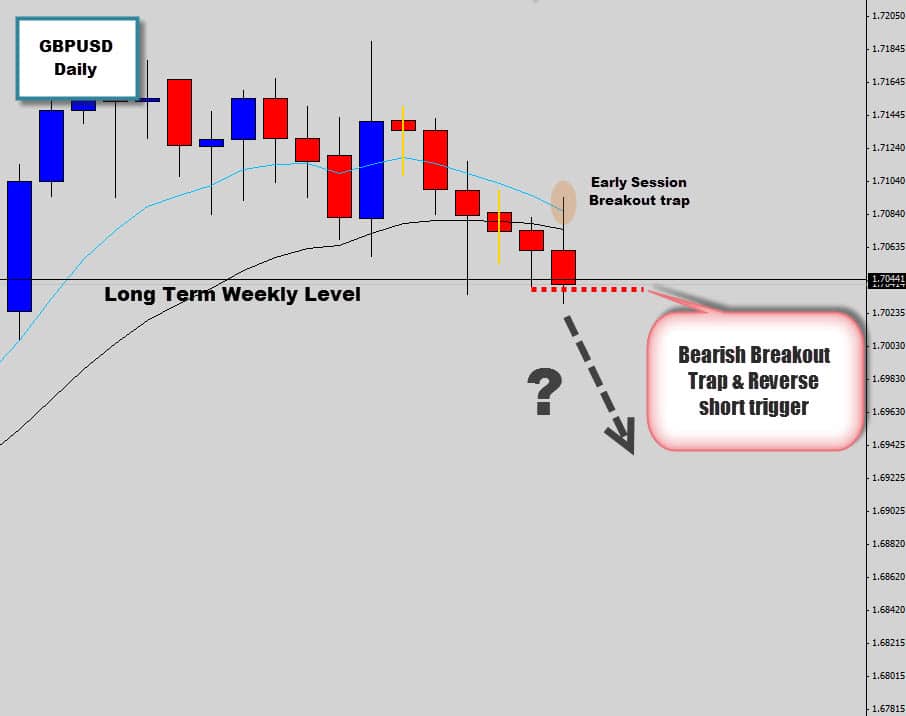
Right now the daily chart shows the market sitting on a critical support level, which really needs to maintain it’s integrity if this market has any chance of moving higher. A breach of this level could lead to a harsh sell off as the dynamics on the chart all switch over to the bear side.
Unfortunately for the GBPUSD bulls, that scenario looks very likely. The market has produced what we call an ‘early session breakout trap’, which commonly occurs during the Asia session.
This is one of the price action trade signals we teach in detail inside our War Room Trader Membership Program.
The trigger for short trades here is when the market breaks the previous candle’s low and activates our sell stop orders. This event actually just triggered while I was writing this commentary, so the trade is now officially activated.
Trade Update
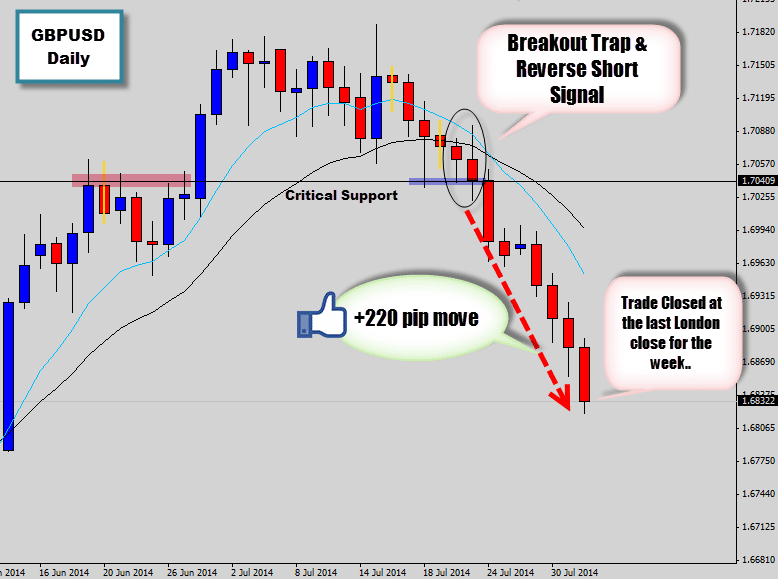
It didn’t take long for this trade to mature into good profits. The breakout trap and reverse trade we discussed earlier on in this post drove prices aggressively lower and there was hardly any resistance from the downside from the support level we were watching.
We used the last London close for this week as our exit trigger. The market was moving so aggressively to the downside we thought it would be prudent to let the trade run it’s course. The market is now extended away from it’s mean value so it’s very likely we will see a bullish correction soon.
The weekly chart is looking very ‘top heavy’, and we could very well see the GBPUSD presenting more bearish price action trade opportunities which we will be keeping a close eye out for.
If you would like to learn more about the breakout trap and reverse trade, or just want to become a confident price action trader, please stop by and have a look out our War Room Trader Membership.
aman
Rather that bullish candle have long upper wick it was at the top of the trend and could be considered as first reversal or a trap before collapsing.
Harald
Very nice trade. But one question: regarding the 1st chart, I do not understand, how is it visible that the candle 4 days before was not identified as a bullish signal, because this looks like a breakout trap (long tail down and recovering over the support line)
Replying to: Harald
Dale WoodsAuthor
Yes it could have been, but the close on the candle was a little negative and momentum at the time didn’t look the best.