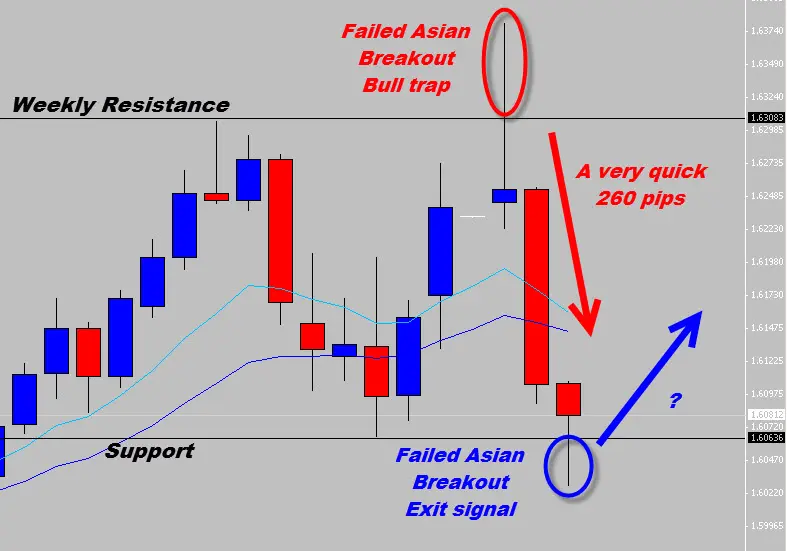
We recently spoke about a breakout of a weekly level on the GBPUSD. The market heavily denied these higher prices – trapping a lot of bull traders into a failing position. When the market rejected the breakout early in the Asian session it left a long upper tail on the daily candle which protruded through the weekly resistance level, that was our evidence of the failed breakout.
Now we did mention there was a strong possibility of a heavy sell off, and indeed there was. This just goes to show how trading without any indicators and using simple, but powerful Price Action setups like the ones in the Price Action Protocol actually are. Now another breakout has occurred during early Asia which has also been rejected by the market. This time the bears have tried to break below a support level which the market has denied. We will be using this one as an exit signal to our short trade.
This false Asian break is a Bullish signal, those more aggressive Price Action traders could look to position long here on the back on any further evidence of bullish Price Action from this setup.
Previous Post

Hey Traders,
Happy new year, I hope everyone enjoyed the break and may 2013 bring many pips for you all. Now that holiday period is coming to an end, liquidity in the market will slowly pick back up and should be back in full swing for next week’s trading.
I’ve spotted a nice setup currently forming on the GBPUSD, although the Daily Candle has not closed yet, it does show evidence a massive breakout of the weekly resistance marketed on the chart. This breakout has quickly been rejected by the market – trapping a lot of bulls who went long on the initial move.
The Price Action Protocol explains how to use these types of failed moves which trap many traders to our advantage. If price closes under the weekly resistance we could see a sell off from this signal, possibly even a long term down move. For those aggressive Price Action Traders there is currently a strong sell signal on the 4 hour chart, which clearly demonstrates the rejection of the weekly level breakout.