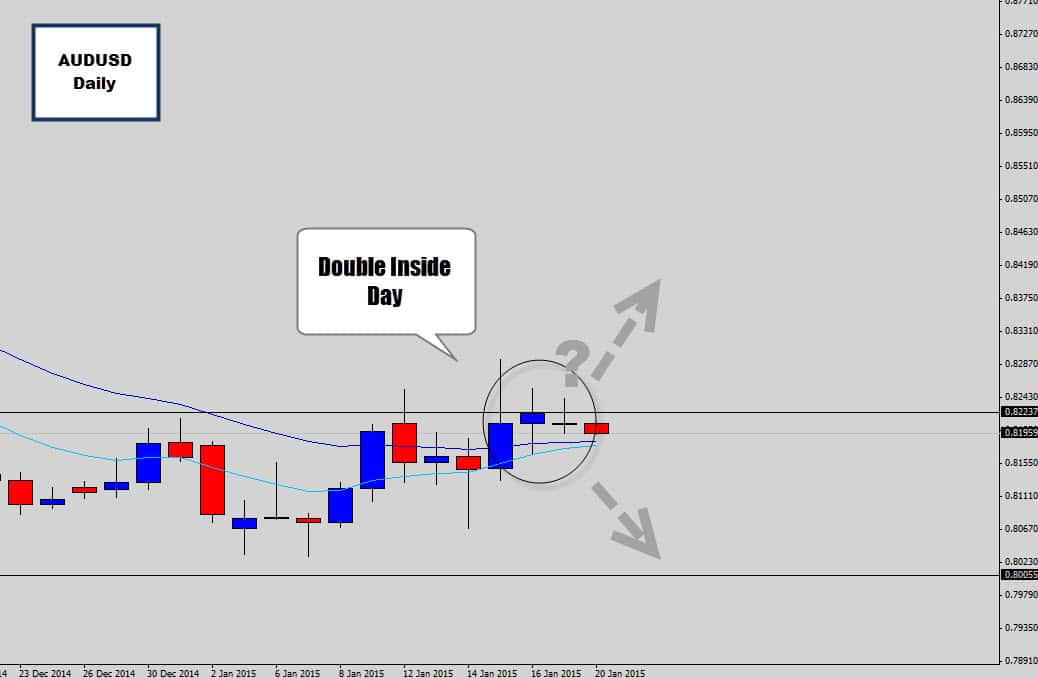
Looking ah the AUDUSD daily chart – which has been pretty uneventful recently…
Double Inside Days on the AUDUSD daily chart, right on the ‘fence line’ here where a break could occur in any direction. We’re currently struggling to get through this resistance level, but also have seen this market pick up some minor strength.
A nice decisive breakout here is what we need, be careful of those asian breakout traps, which would be especially dangerous through this resistance level.
Due to the SNB incident last week, trading this week may be severely interrupted as brokers go down, traders shuffle around and the market as a whole regains its breath…
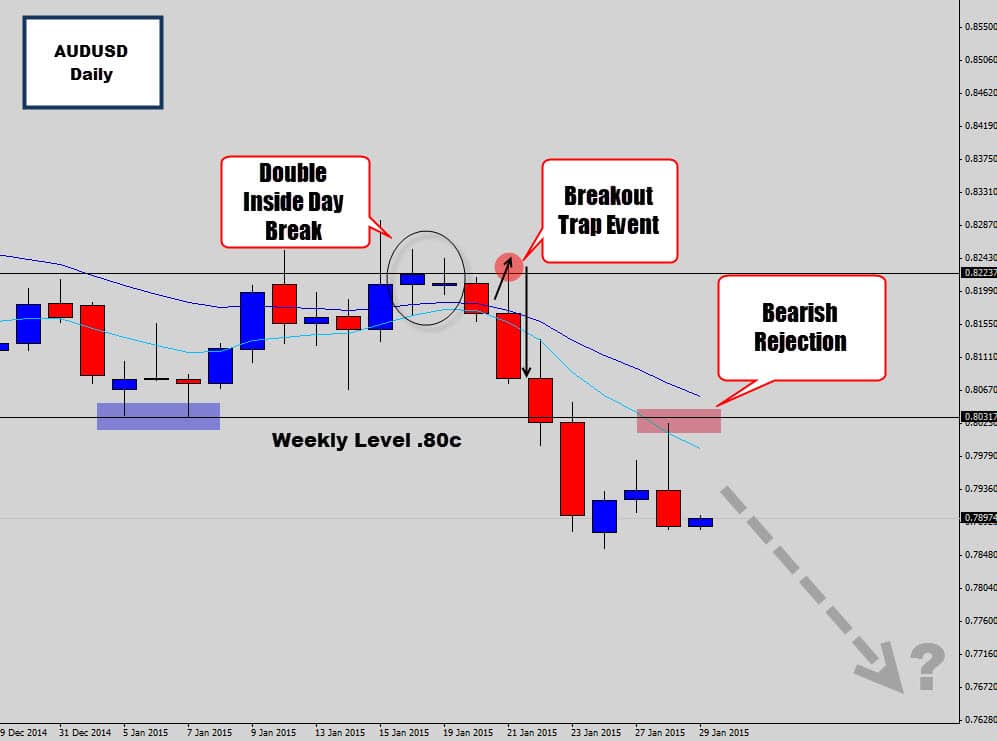
The double inside day setup ended up breaking down to the bearish side as the resistance level holds. This setup did experience a moderate retracement – which would have tested the discipline of some traders as the trade moved from profit into the negative for a brief period of time.
The retracement for that day actually caused a bearish breakout trap and reverse price event, something us War Room traders know is a very potent catalyst for extended breakouts.
This breakout trap and reverse setup certainly did take off, launching the price action combo setup into lower prices, smashing through a weekly support level.
Now that we’ve punched through, and closed below weekly support, ideally we need a bearish signal on the underside of this level. This is exactly what happened, we got a classic ‘breakout and re-test of a major price level’ here in the form of a bearish rejection candle.
The bearish rejection candle’s anatomy itself is pretty solid – an nice strong close below the open, giving the setup some bearish weight. This would have been a text book perfect setup if the setup formed closer to the 20 ema. Despite that one thing, lower prices are very likely to develop off this setup.
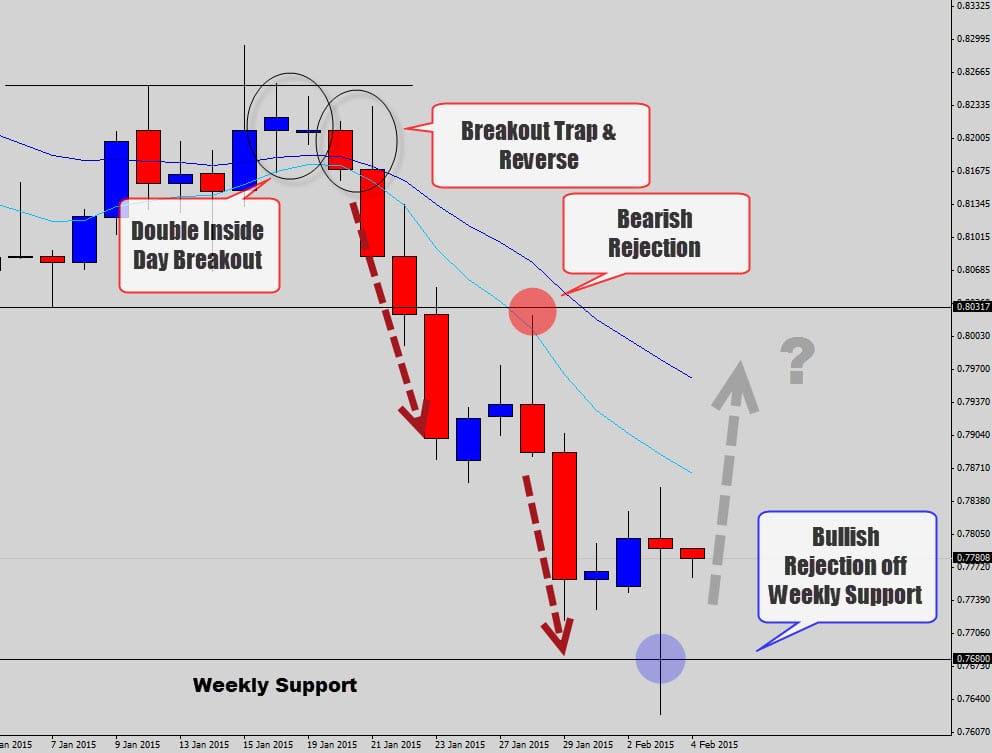
The bears still had business with this market as the bearish ‘breakout and re-test’ structured rejection candle fulled further lower prices. This extended the the original bearish trades into much better profit for any traders that held on here.
Now the market has moved into the next weekly support level, where we have seen a strong bullish reaction. The trading day closed a bullish rejection candle, which is a ‘red flag’ to anyone still short here. Because this is a weekly level, the bullish counter-trend price action setup has much more value and the large range of this candle also gives this bullish setup more authority – should it be taken seriously.
It’s hard to say if a long move, or a shorter term bullish correction will come out of this, but the odds are we will see some sort of bullish price movement develop from this counter-trend setup. Let’s see how this one plays out.
If you would like to learn more about trading with price action like this, you may be interested in our price action course, which you can access through the Forex War Room.
Cheers and best of luck on the charts this week!