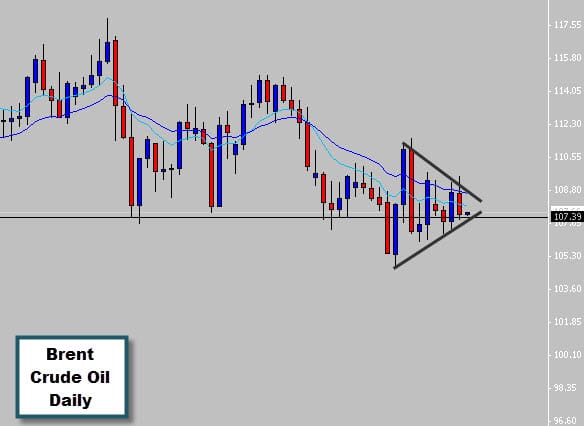
I’ve been watching a situation develop on the brent crude oil chart the last 2 weeks, a Price Squeeze pattern has formed on the Daily chart right on top of a major support line in this commodity market. This sort of price congesting and squeezing usually leads to a strong breakout, the fact that the churning is happening above a support line could indicate pressure of a pending bullish breakout. However nothing is certain in the market and price could easy break down below, if you would like to learn more about trading Price Squeeze Patterns please see the Price Action Protocol.