Taking a look over at the crude oil market today where an interesting price action event has occurred. The chart about is the Brent Crude oil market, which is the UK based one. The other major crude oil market is the WTI which is US based.
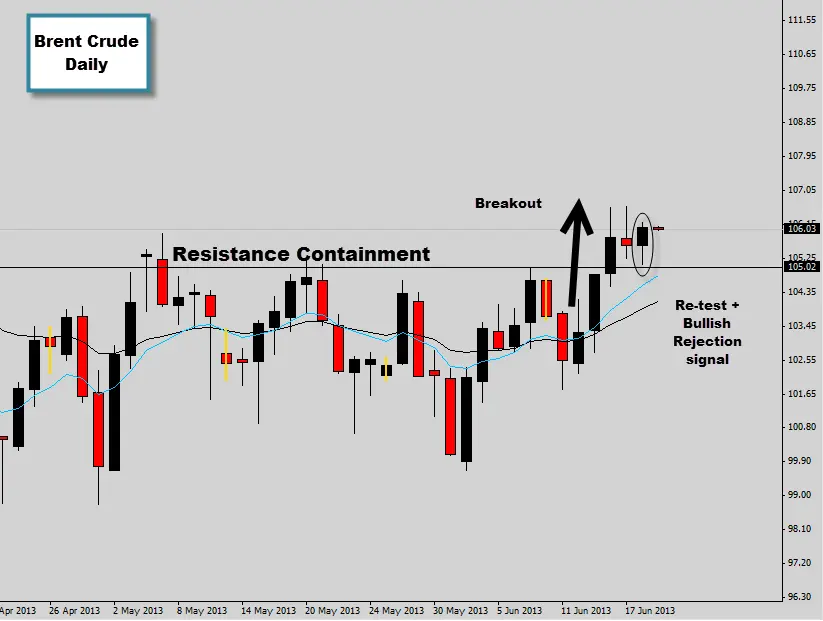
Brent crude (and WTI for that matter) have been consolidating sideways lately creating undesirable trading conditions. On the Brent crude chart it’s easy to identify the resistance level which has been acting as a containment line for last couple of weeks, keeping price firmly below. Notice the flat EMAs = no momentum.
Last week we seen price rally upwards and smash this containment level, now the thing that has caught our attention is the retest of the containment line from the opposite end. The market has now respected this level as support by printing a bullish Rejection Candle signal at the New York close last session.
If price can push above the Rejection Candle high we have a valid long trigger, this could be the beginnings of a new upward trend. However this is the oil market and we all know it can be subject to high volatile movements, so keep that in mind.