nbsp;
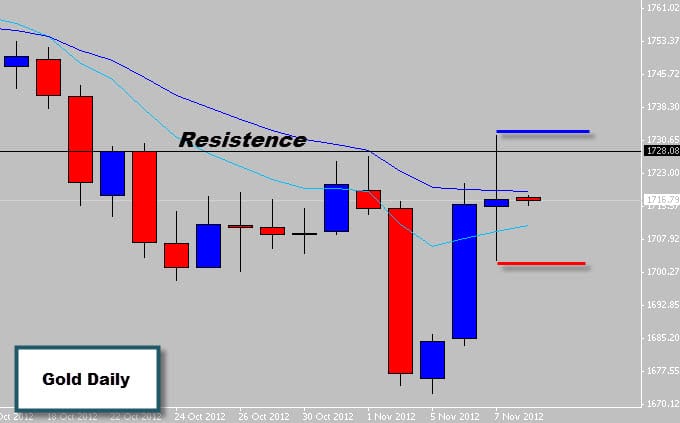
Looking at the gold chart today I’ve spotted a very obvious indecision candle formation that is covered in the Price Action Protocol. What’s interesting is the location of the signal and the recent price action surrounding it. The Indecision candle is sitting right under a strong resistance level where the trend mean value also lines up with. The overall trend is down so shorts on breaks lower would be ideal. However given the recent bullish price action in the market, price action traders shouldn’t rule out the possibility of a bullish break out of the top. The indecision candle really is sitting right on the on the fence here so a break in either direction is possible. A bullish outbreak would be considered a counter trend trade so make sure you’re absolutely sure before trading against the trend.