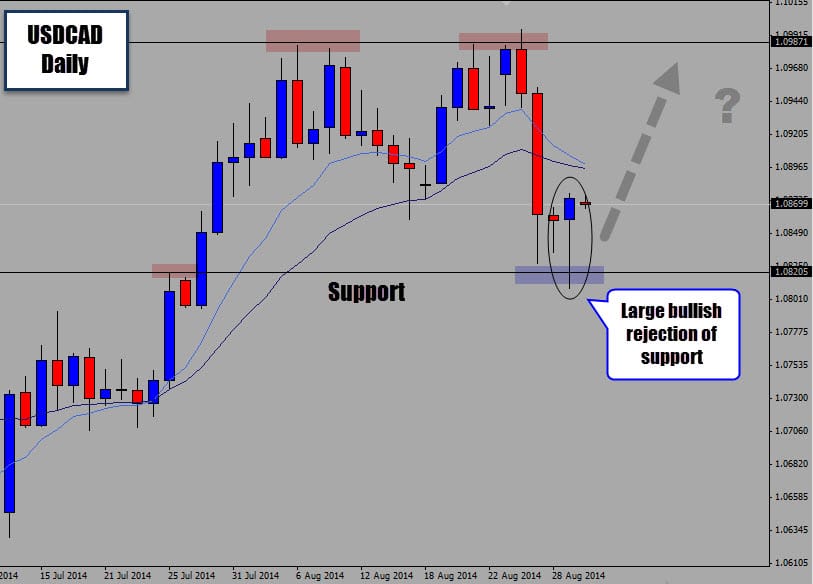
Last week we seen the CAD strengthen as it failed to move through overhead resistance. The USDCAD daily chart shows price has now moved into support and responded with some aggressive bullish price action.
The market rejected an attempt to move lower into support and closed as a bullish rejection candle.
The signal candle also managed to close higher than it’s open price, giving the body some nice bullish tone. This market is absent of a dominant trend one the daily and weekly chart, giving the USDCAD a more ‘neutral’ setting.
If this bullish rejection candle trade plays out, and prices continues to move higher, we could see a retest of the overhead resistance.
Trade Re-cap
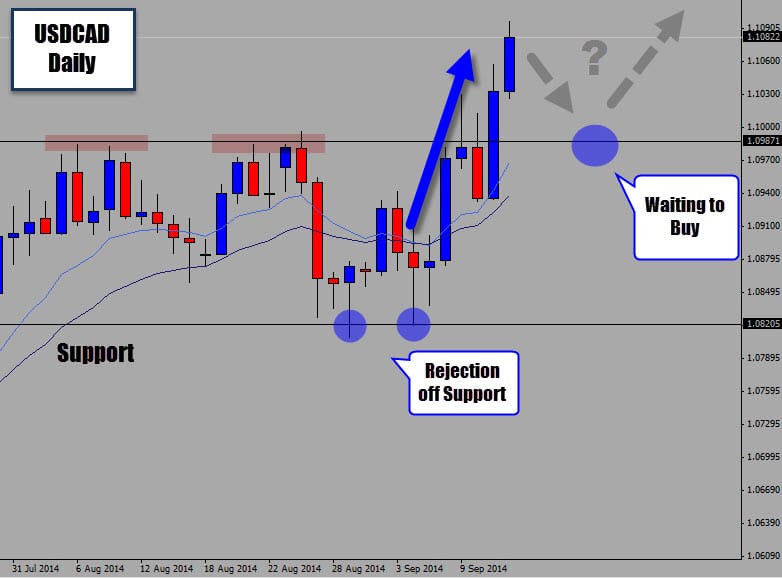
In our previous commentary of the USDCAD, we look at a bullish price action setup that formed off a support level. The market was in a ranging pattern and this was a classic buy signal at range support. We were looking for the signal to trigger and re-test the range top.
The market initially moved higher, but tested the range support without triggering our trade stop loss. This produced a second chance opportunity for other traders to get long who initially missed out of the first signal. The market fired upwards after the second rejection candle, where we got the test of the range top we were looking for.
A bearish looking rejection candle formed at the range top, which would have been a second confirmation to exit the long position as it appeared the range top was going to hold. Despite the bearish price action at the range top, the market regained strength here and breached through the resistance level.
Now the market is clearly trading above the range top, we will be looking for retests to the range top and anticipating it will hold as new support. This is a hot spot we can target bullish price action signals to form, and jump on-board the bullish momentum.