We’re currently in the middle of the Summer trading period, which has a notorious reputation for producing slow price action, and making it hard to get into a profitable move.
Thankfully, this year we’re not suffering too much of a drought – there have been quite a few good trade signals that we’ve been talking about in the War Room commentary and on the blog here.
Today, I would like to share, and review some of these trade setup that have occurred – some where winners, some losers (as you would expect).
Let go ahead and check them out…
USDCHF Rejection Candles
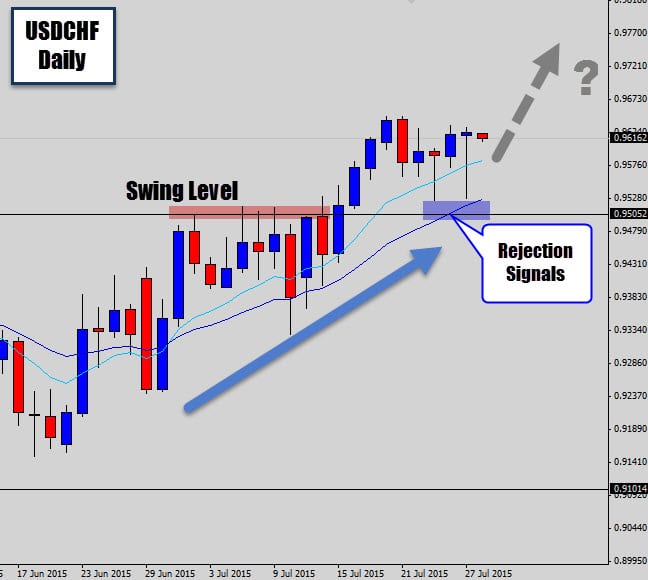
Checking out the USDCHF today, we’ve got a nice set of bullish rejection candles coming off the mean value.
This is an ideal pair to be trading with at the moment, due to it’s stable trend. We can see the mean value is holding as dynamic support and is making the classic higher high/higher low stepping pattern.
Ideally retracement entries would be great here. The location of these signals make this a high probability trade coming off a nice clean swing level and also being support by the trend’s mean value.
This trade setup worked out beautifully – the trend momentum remained dominant and price followed through very well out of this rejection candle group.
It would have been a test of discipline to hold this trade, as there were a few deep retracements that would have made traders nervous – especially if you’re one of those Forex traders who stare at price charts a lot.
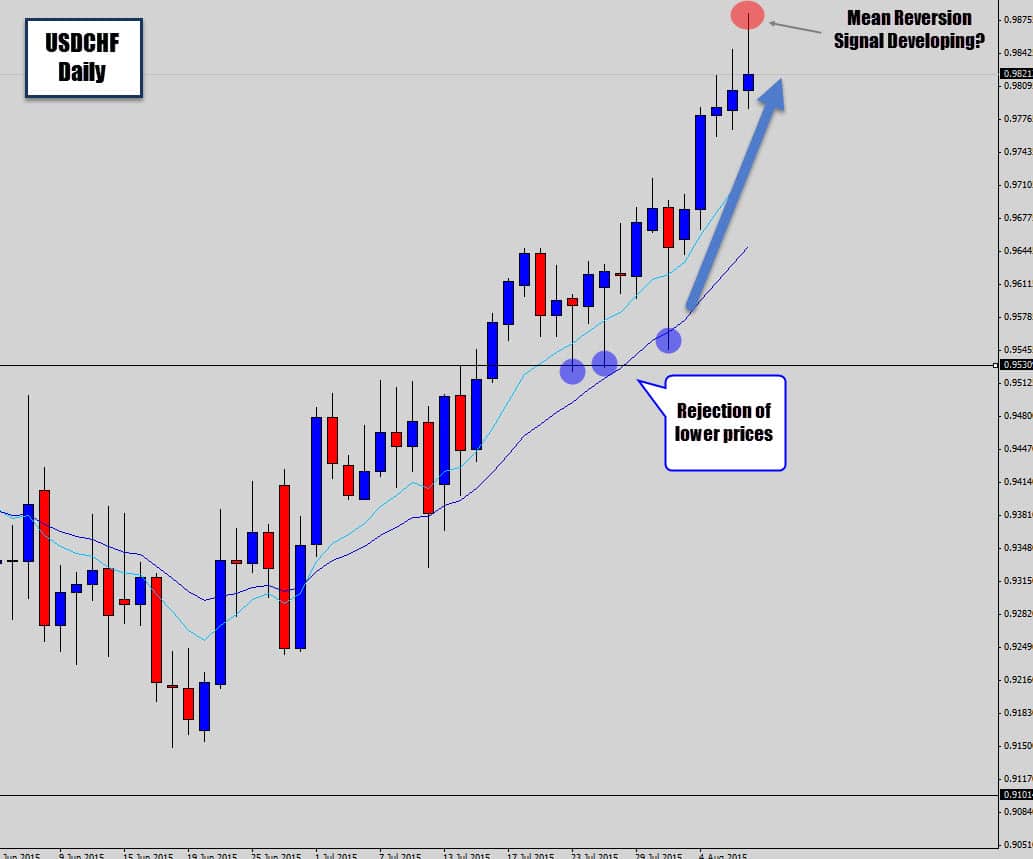
Now the market has ‘peaked out’ here by extending itself away from the mean value, it is starting to show signs of weakness at the market is starting to retrace down from these higher prices.
We may get a mean reversion sell signal at the end of day here, which could kick off a sharp move back to the EMAs.
GBPAUD Inside Day Breakout/Fakeout
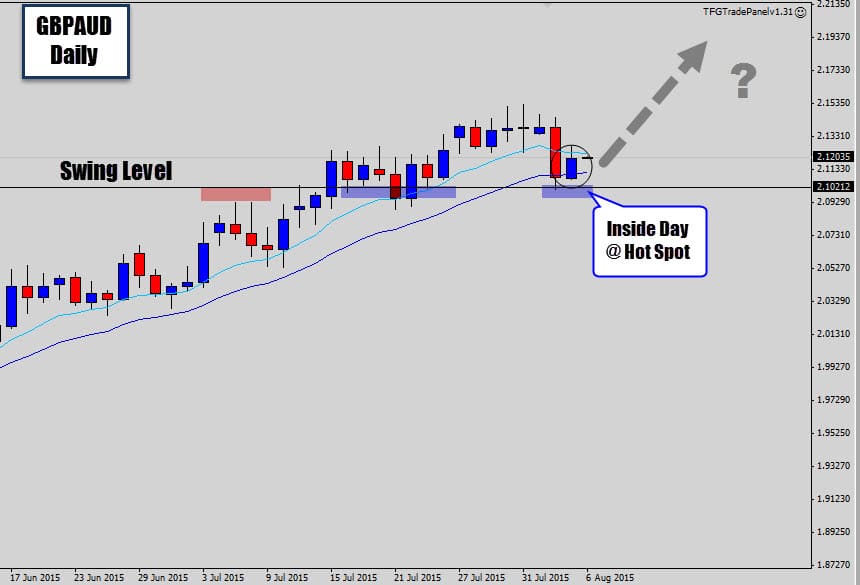
We’ve got a nice inside day here on the GPBAUD. Price is currently hovering around at the trend hot spot, which is the most optimum point for stable trend entry.
If price breaks the high of the inside day, we could definitely see the next move into higher highs.
We do have some hot AUD news coming out in the Asia session, which may fuel an Asia session breakout. If you do decide to take the breakouts, re-check the market around the London open to make sure the breakout is holding, and there are no signs of an Asia breakout trap.
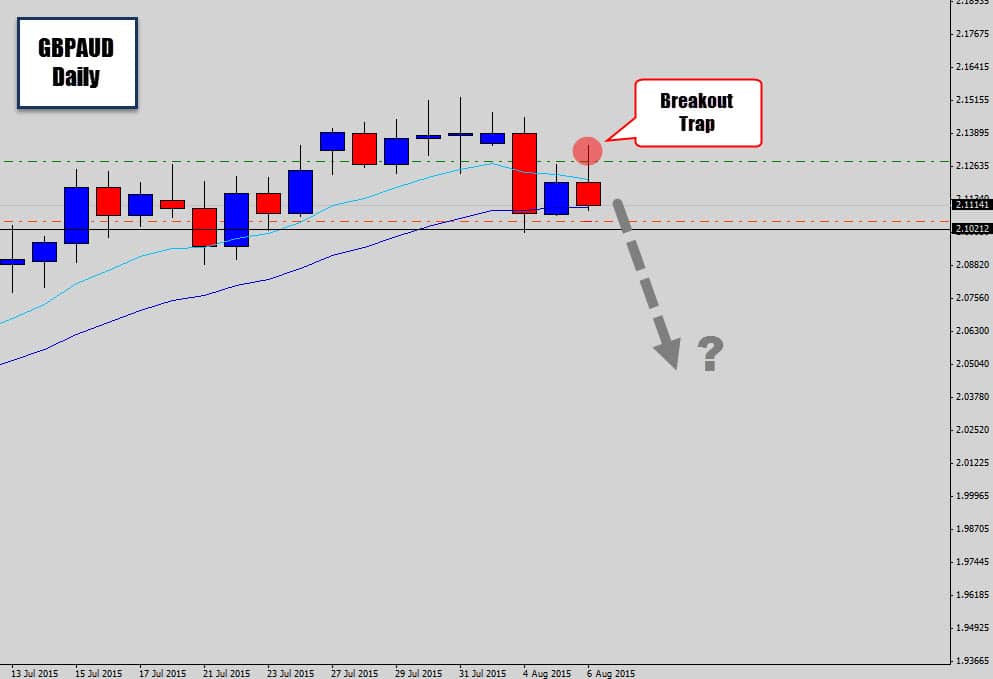
Looks like this setup has failed, I got caught in a breakout trap as price broke the highs of the inside day but collapsed in on itself quickly
We’re going to get a sell signal here now, which could be a game changer for this chart. The bearish rejection candle has made a lower high, and looks like it is going to close with a heavy bearish body.
I am going to try use Asia session retraces to exit with less of a loss – instead of cutting the trade right now, and even consider shorting the bearish rejection candle if we get the retracement opportunity.
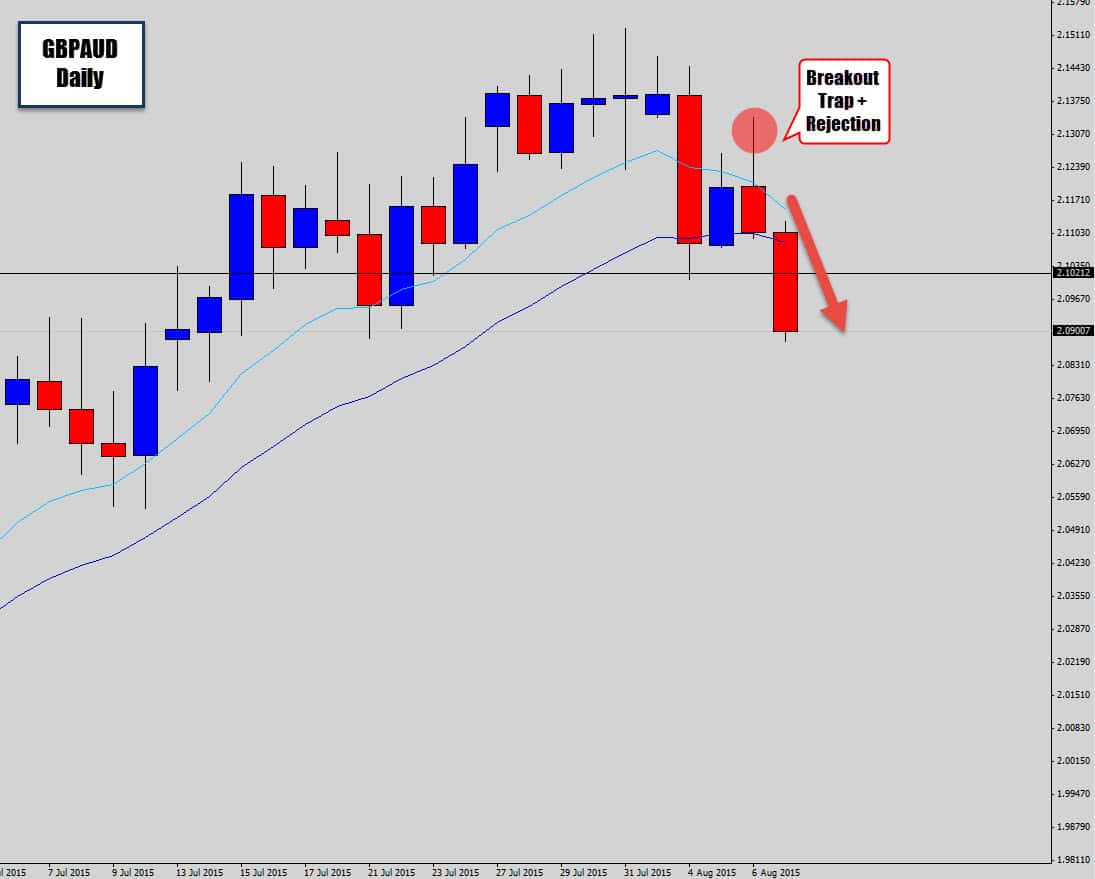
The market didn’t play ball with me on this one, triggering me into a breakout trap and not offering a retracement entry to reduce my loss, or get a short entry… shame.
One of the factors of being a trader is dealing with trade ideas that don’t work out. I don’t mind sharing losing trades and talking about them, I think it’s healthy to do so. In hindsight, this inside day wasn’t really as ‘tight’ as I would normally have liked – I generally like my Inside Day signals to be tight in range, this one had a decent size range to it.
Another hindsight fact here is this trend has existed for a long time, making a lot of ground on this chart. Generally, trends have a ‘shelf life’ and the longer they occur, the less likely they are to continue to moving in the same direction. The market doesn’t like to move in straight lines, even on a macro scale like this, retracements and corrections occur.
Now I am waiting for a short signal to develop next week, as this chart looks like it is going to transition into a bearish trend.
USDCAD Rejection Candle @ Trend Hot Spot
The USDCAD has been in a nice uptrend, which aligns with the fundamental strength of the US Dollar.
We can see price has just retraced back into the mean, and into an old resistance area. Zoom out a bit on the chart to see this resistance.
A bullish rejection candle formed as buyers re-entered the trend at this hot spot. It would have been nice to see this candle a little larger in range, but it is backed by a strong established trend, and located at a nice turning point.
If the trend momentum continues here, we could see his market push into new highs off this signal.
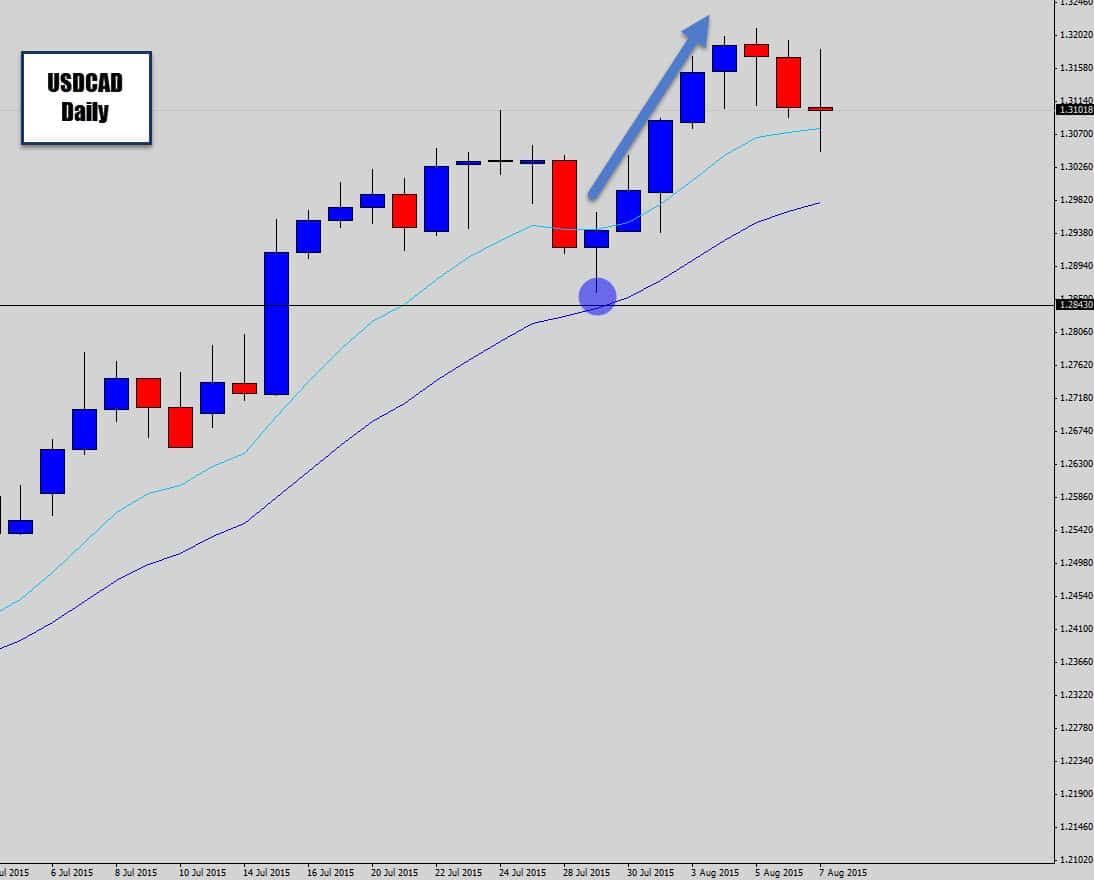
This high probability swing trade setup worked out nicely as expected, Pretty straight forward ‘text-book’ kind stuff here. A bullish reversion signaled higher prices from an optimal trend entry point – it doesn’t get much better than this.
I wasn’t able to get into a long position as I was chasing a retracement entry price – but I know a lot of war room traders took the breakout here and made a nice return.
Now, we’re just waiting for the next buy signal to occur off the mean value, or bullish hot spot that may develop at these higher prices.
GBPUSD Sell Signal off Strong Resistance
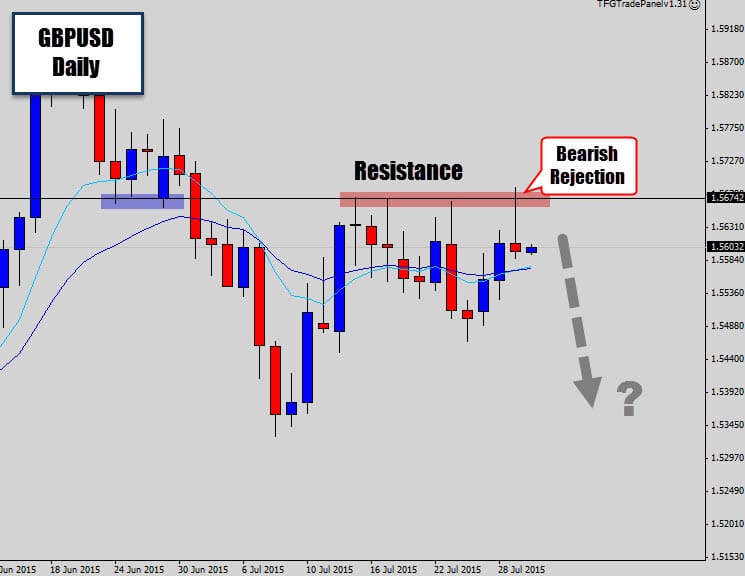
GBPUSD has been stuck in this holding pattern under a stubborn resistance level on the daily chary, which has been containing price for the past couple of weeks.
Again, the market moved up into this resistance level and the higher prices were denied, and pushed back lower to create a bearish rejection candle in response to the Fed’s FOMC release.
I am not sure what the Fed’s position was, but we can see the GBPUSD responded bearishly with the increase in USD strength. If the market breaks lower, we could see a breakout to the downside and a move into lower prices.
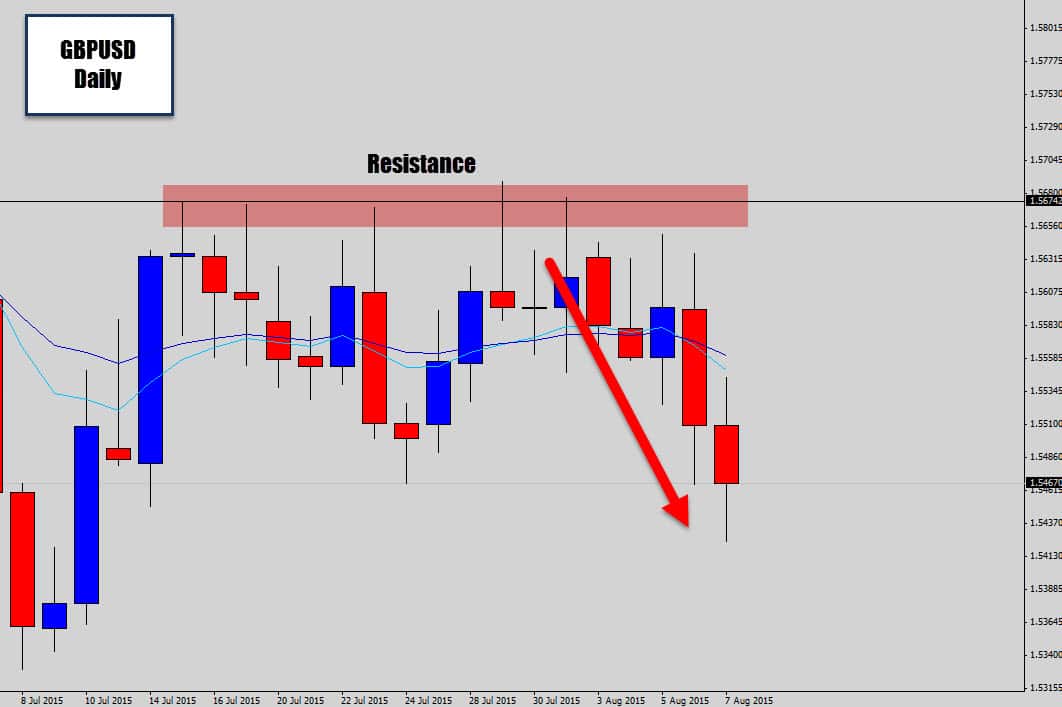
The resistance level held strong and the bearish price action that developed off this level was the chart communicating to us that lower prices were highly likely to develop.
This is another trade that would have taken some discipline to hold through, as there were many deep retracements. Generally traders like to see instant gratification, where a trade triggers, moves into profit and stays in profit. This short trade would have sent your floating P/L oscillating up and down while the market built bearish pressure to finally sell off.
This is typical for the summer trading season – where volatility has been sucked from the market, we seldom see those nice clean volatile price follow thoughts – we need to keep our discipline cap on, follow our trade plans through and be picky with the trades we do decided to take, making sure they are good quality signals.
If you would like to learn how to trade Forex charts using simple price action analysis and swing trading strategies like we’ve talked about today – please check out the War Room Membership for Traders. We discussed trade setups like this every day and provide a very comprehensive trading course that will teach you all the advanced tactics and strategies you need to make money with your trading.
I look forward to a continued discussion with you – best of luck on the charts!
Abton Muroyiwa
Thanks a lot. I am a beginner trader and i was finding it hard to master trading using market structure. I used to have my charts all cluttered with shapes, lines and moving averages and would end up not knowing which indicator to follow.
After going through just one article of yours as well as going through your marked up charts I now have a clear view of what to look for on my charts.
I really enjoyed the content
khairul
Hi TFG, I really enjoy looking at your trade call or trade update. One thing that really attract me towards your system is it’s simplicity (no indicators and clean chart!) as well as the fact that you are trading based on daily close (less time required to trade the market). I’m saving money to become “War Room Trader”. Hopefully I can save enough money by end of this year.
Hope you can do a weekly/biweekly/monthly signal replays. Wish to learn more from you.
sentosazr
thanks of analisis .you are the best and great treder
RG
Hi Rayner,
What period is your EMAs? And may i know the reason why you’re using those periods?
Thanks!