
What an explosive start to the week. As anticipated the French election business caused a large gap in the market, most extreme on EUR pairs.
Those large gaps throw out the flow of price action, so kinda hard to trade them. Don’t be one of those “the gap must be filled” traders – that strategy doesn’t work.
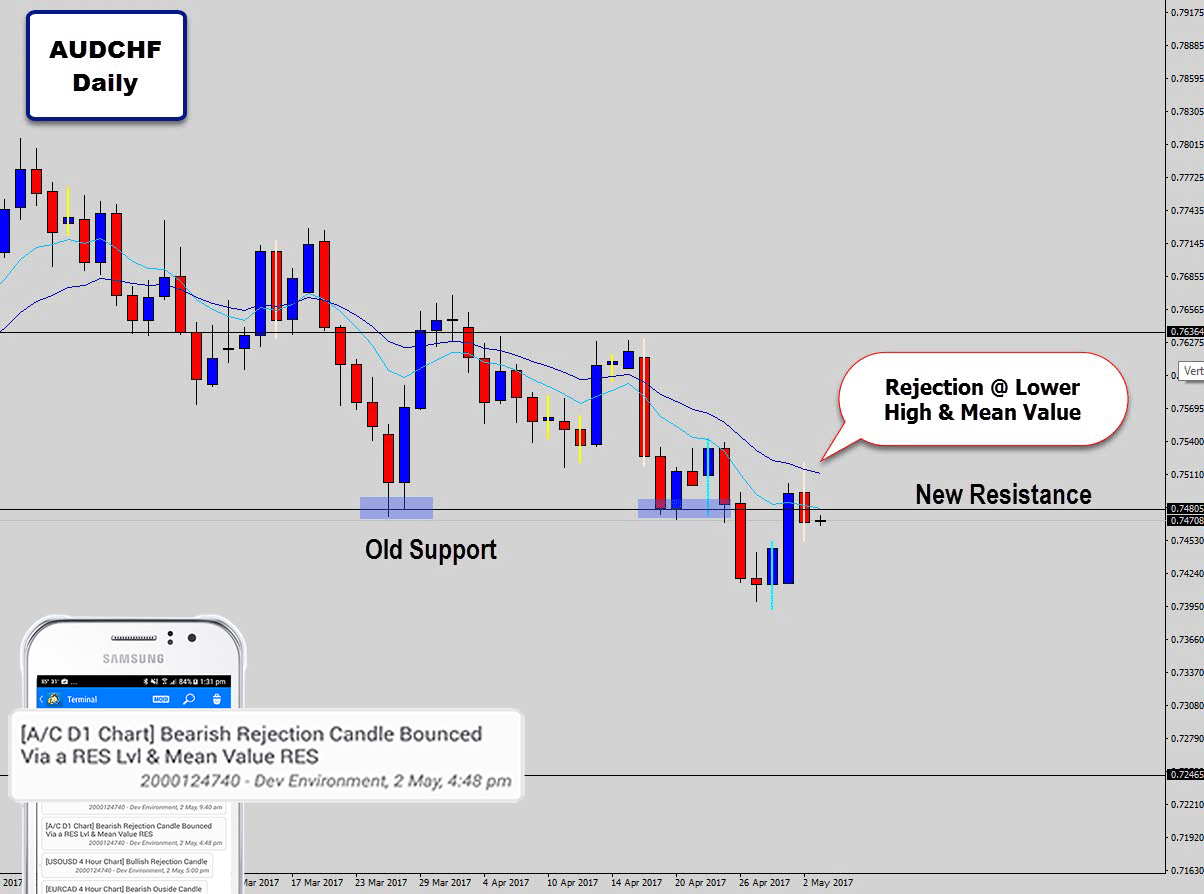
I got an alert from the Battle Station this morning about the rejection candle here on AUDCHF daily.
I spoke about this scenario in the war room video commentary this weekend. We’ve already seen a small bounce off the level on the previous test of the level, now this is a second, more convincing test which adds more value to the bullish reversal trade plan here.
It looks like the market is falling into a range bound structure, so if the setup works out, a simple 1:3 should easily be hit, or if you want to go for it, a move to the range top is possible.
Just watch those declining swing highs, they make a falling trend line (I didn’t draw it), which could pose an issue for higher prices. A target set at the trend line would be a safe move.
The Range Didn’t Hold

Unfortunately this bullish trade idea didn’t work out – despite the high amount of value we were able to build into it.
Trading reversal signals off weekly levels is a high probability venture – but with Forex, nothing is absolute so there is always the chance for a trade idea to fail.
The market didn’t give up any bullish follow through at all, the bears just come straight in and cut through this level.
At this stage it looks like the weekly level will fail, which will put us back in the sellers seat – where we can start looking for short opportunities on lower highs.
I thought I would mention one observation.

Time and time again, price action from the weekly chart shows us it is the boss.
Generally, when you get a weekly candle that closes heavy with a bull or bear body, there will usually be some continuation of that in the following week to come.
You can use the weekly price action as a quality control filter for your swing trading, which is mainly focused on time frames h4-daily.
This is why I believe my Quant analysis projects are important, so we can get data on this.
So I will get back to work 🙂
In the mean time, see if you can pick out any correlations between the previous week’s candle, to the success/fail of your trades.
The Weekly Level Breaks, And the Anticipated Sell Arrives

A nice swing trade for us this session on the AUDCHF. I got a detailed Battle Station alert at the session close, informing me about the rejection candle signal interacting with the mean and resistance.
I hope everyone else was able to catch the alert.
So we can see a nice down trending structure here, lower highs followed by lower lows. Right now the market just made a lower high, which is where we normally look to sell (selling high in a downtrend).
The mean value also acting as resistance here, but this area is backed by a nice level, which was previous support, now holding new resistance.
Referring back to the trade idea above – the bullish signal we were looking at off weekly support…
Well since that previous signal, and support level have failed, the market has come back up to re-test the weekly level from the other side – demonstrating to use price action traders, that it is now holding as new resistance by printing a bearish rejection candle there.
A hot spot for a price action swing trade.
There is a nice thick bearish body on that rejection candle too, showing a clear attempt to try move higher, fail, then close a lot lower for the day.
This is the kind of trend trade we wait for! Retracement entry hopefully will be triggered.
Plenty of room lower before next major support level.
Good luck to all those on this trade.
The Trade Explodes Into Profit, Fast

A really great outcome for this trend swing trade.
It’s always very uplifting for a trader when their analysis pays off – nothing like the feeling of being in a trade you foretasted by reading the price action.
These kind of ‘breakout & re-test’ trades are usually very explosive. They don’t show up everyday, because you need to market to break a major structure level, then re tap it from the other side and drop a price action signal.
When they do pop up on the charts, they should have your full attention. These signals usually mark the beginning of a developing trend.
Usually we need a bit of patience to allow this swing trades to mature to full profit – but in this case, traders were fortunate as it dropped hard and fast. This kind of outcome doesn’t happen as often, but when it does no one in complaining.
A likely target for this trade is the next weekly support level. However, since the market has dropped fast, we are looking like we are in an overextended state – so watch out any price action that signals a potential mean reversion move.
Any sign that the market wants to return to the mean, like a strong bullish candle, would create an earlier exit signal for this trade.
All the best.
The Mean Reversion Signal Arrives – Time To Cut the Trade

As feared, this down move was too large and fast to be maintained for long.
The rapid downward acceleration of price has caused a gap between the mean value and the market price.
This gaping is a precursor to a sharp correctional burst, called a mean reversion. Whenever you see this gap, a strong correction is likely coming soon.
In this case, we actually have more confirmation that a correction is brewing, because there is now a bullish rejection candle sitting at these extreme prices.
This is actually a tempting buy signal, but more so, it is acting as an early exit signal for our bearish trade, for those who are still short.
It is probably best to consider exiting here, collecting profit and not risking sitting through this likely harsh correction we are about to see.
Most of you would be up by 3x risk/reward anyway, so the trade has done it’s job.
If you want, you can switch to a buy position on the basis of this mean reversion move, but otherwise, wait for further bearish signals to form off lower highs with the trend, preferably close to the trend mean.
Let me know how you go with this trade 🙂
Wow! Another Bearish Trend Signal

This chart won’t stop giving up the goods, the price action here has been awesome.
For those who took that bullish mean reversion trade, it actually worked out as anticipated.
The market returned all the way back to the mean, creating some profit potential there.
I got another battle station price action alert when the markets opened, making sure I was well aware of another swing trade opportunity here.
The alert also gives me some information regarding where the signal formed on the chart.
This alert is highlighting the fact we have an outside candle bouncing off the mean value.
Now the market is back at the mean, this is where trend traders can look to sell off lower highs again, and behold – another price action trend trade signal has appeared!
A bearish outside candle formed right at the mean, suggesting the down trending structure is holding, and trend continuation is likely to follow.
The previous trade didn’t push the market down to the weekly support, which is what we were initially targeting. However, this trade may be able to push the market down there to the weekly support, where we would 100% be looking to take profit
There is no reason to try risk trading though that weekly level.
Outside candles are very similar to rejection candle reversal signals, but outside candles have a stronger anatomy. They get better follow through in my opinion.
A pull-back entry would be golden here, to tighten up the stop loss and increase reward potential.
Best of luck on the charts for this one guys.
Weekly Support Hit – Target Met!

A great outcome with this next swing trade with the bearish trend on AUDCHF.
Another ripper trade, that produce fast profits (3 days) as the market absolutely tanked into weekly support.
Anyone on this trade would be very happy right now, especially if you targeted the anticipated move to weekly support.
Before I mentioned there is nothing like the feeling of being in a price action trade that you derived from straight forward technical analysis, and having it make you good returns.
Thank you AUDCHF, you’ve been very good to us. Now will you continue your awesomeness by printing a large bullish reversal candle on weekly support?
Weekly levels really are where you’re going to see the best counter trend reversal opportunities, so we will see if we get another great trade opportunity here.
Definitely not interested in trading through the weekly support further to the downside. I highly recommend anyone who is short, strongly consider an exit now.
The level may see a short breakout to the downside, but it will likely manifest into a takeout later on. That kind of thing happens time and time against on major weekly levels.
I think I will wrap this post up here, it’s been a long documentary on this pair the last couple of weeks.
If you would like to learn how I read price action to make trading decisions, or get your own battle station alerts (like I shown on some of the signals above), then you’re more than welcome to check out the War Room – where all of the tools and Forex course is located.
Thanks for reading, and if you following along and got to catch some of these trade – well done.
All the best on the charts and hope catch you in the next post.
Steve Epperson
It’s nice to see a professional trader display increased levels of enthusiasm as each month passes. You certainly have displayed that with this post. Lucky for the rest of us, it’s contagious. Thanks once again for sharing.
Rauf Ahmad
Amazing Trade Setup
James
Hey Dale,
I haven’t been watching AUDCHF, but rather AUDUSD since it’s a major pair. What do you think about the daily level that looks to be holding up. As soon as it hit the daily level, it sold off sharply making me think there’s further downward pressure:
Daily chart: http://icmarkets.ctrader.com/images/screens/bMlpn.png
Over on the hourly, I see a wedge breakout with strong candle so another sign this consolidation is over and will resume further bearish.
1-Hour chart: http://icmarkets.ctrader.com/images/screens/0Mlpn.png
Looking forward to hearing what you think!