Looking at the USDCAD as it hits a potential major turning point. Last time the market failed at this level we seen a 500 pip drop visible on the daily chart.
The market re-tested this level last session, but the higher prices were rejected again for the second time at this level. If we get a repeated response, there could be a decent bearish move off this level.
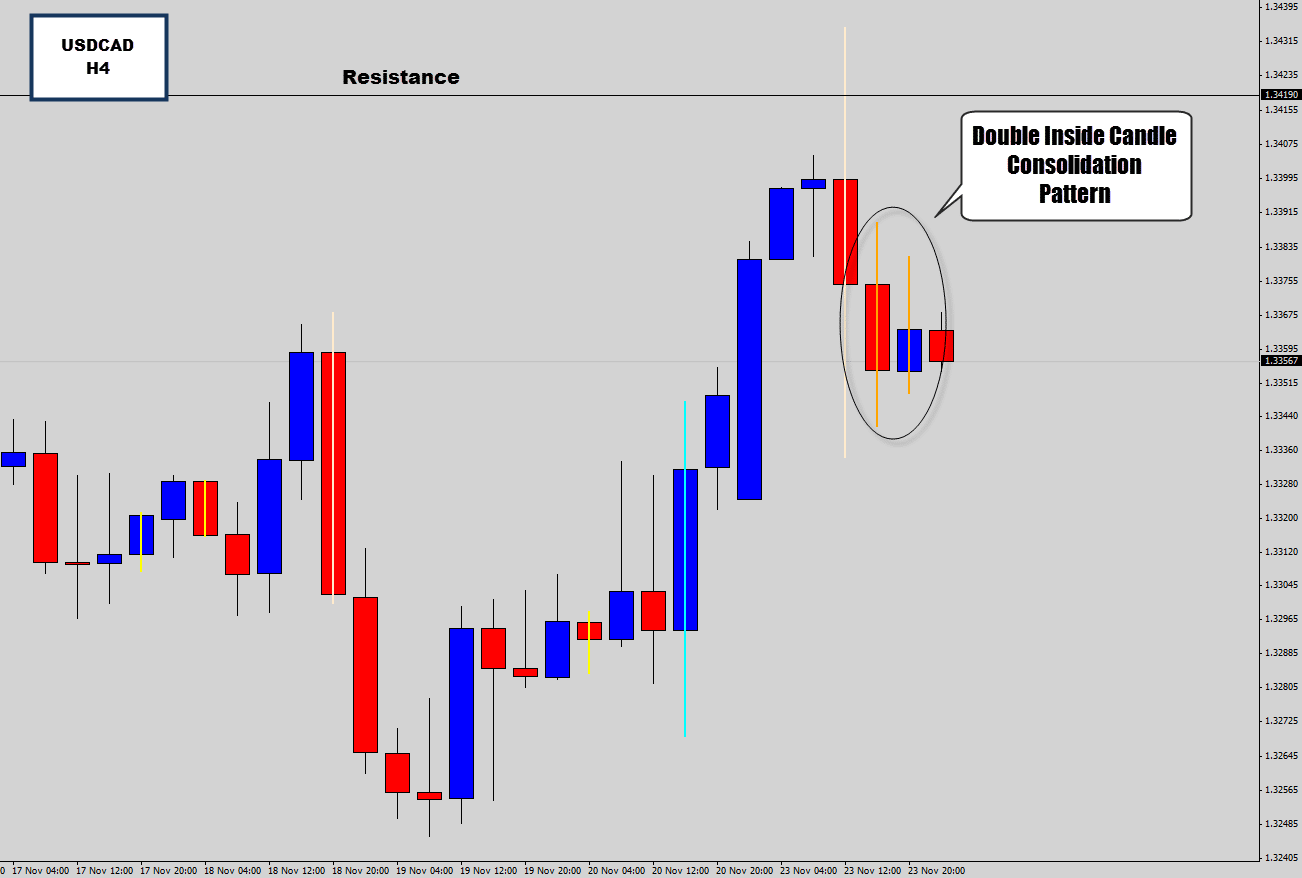
My Price Action Battle Station algorithm sent me a notification to my iPhone about a double inside candle setup it found on the 4 hour chart – which I seen when I got up this morning. So I checked out the setup, and there is potential for a bearish breakout here.
I don’t normally worry about inside candles on the 4 hour – but double inside candles (marked in orange) seem to have a much better success rate. The main factor here is the major resistance level acting as a potential turning point. There isn’t anything to work with on the daily chart – but a downside breakout could be triggered as price moves below the double inside candle setup on the H4 chart.
Because this pair generally moves the most in the New York session, it would probably be best to avoid taking any breakout style trades until the US session does open to avoid getting caught in early breakout traps.
Market Drops Down Out of Double Inside Day
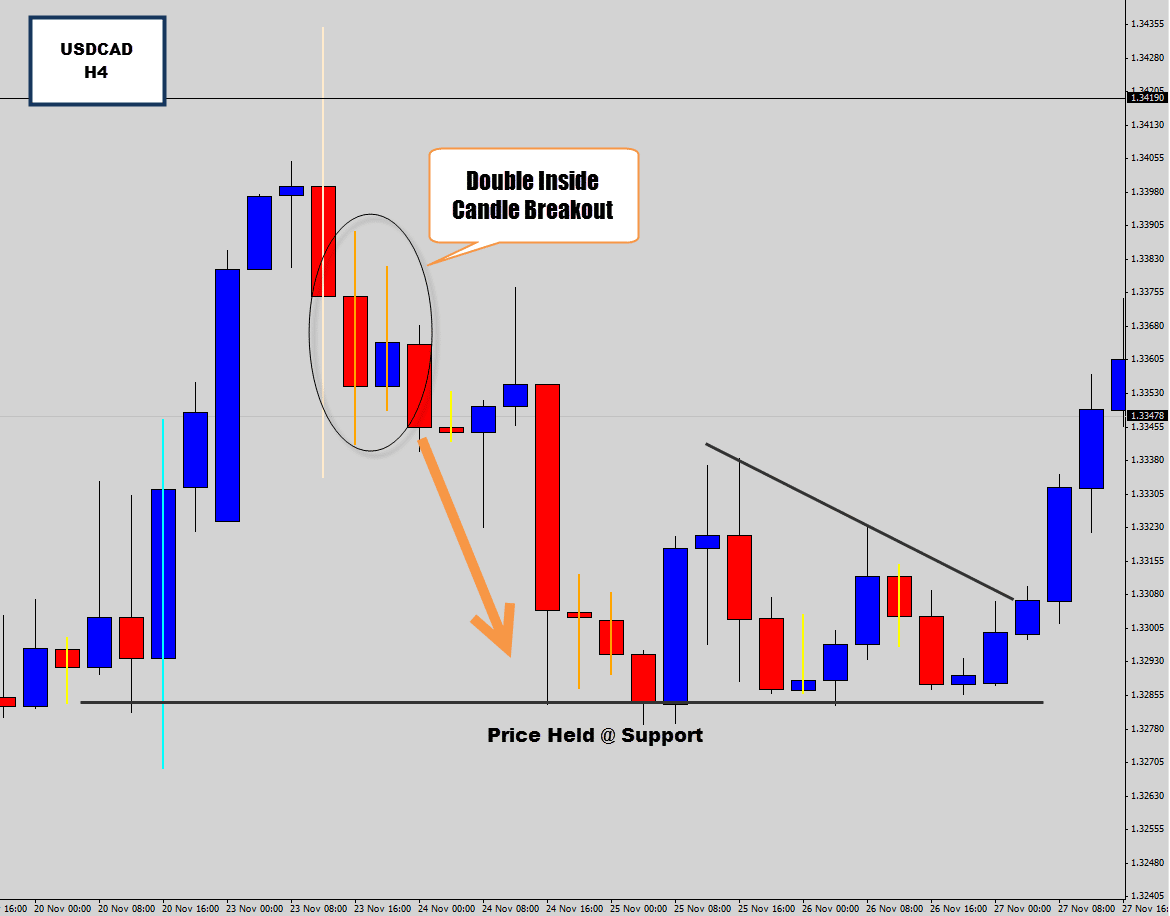
We did see a breakdown out of the double inside candle setup, but not really the long extended move we would ideally have liked to see.
Price broke the lows of the setup, triggering short positions – but then retraced moderately back up into the double inside candle range. Price did not breach the inside candle’s structure highs, so stop loss limits should not have been touched there.
The disciplined trader who stuck with the plan, and held onto the trade would have be able to at least catch a move into the next support. The support level did hold here, so we seen the bulls pick up and push the market back higher off this level.
The reasons why this trade looked appetizing is due to the fact it formed around a major market level, which are key turning stones for the market. If you want to catch big moves, you need to watch these major levels and play any compelling evidence a reversal is about to occur.
If you would like to get away from the fast paced in-and-out kind of trading, and focus more on the broader market moves – checkout the War Room. It contains a very comprehensive swing trading course which teaches you how to catch major reversals in the market and powerful techniques to remove risk quickly from the market.
Januario Antonio
Sorry, Dale
For drawing trendlines we should use 3 anchor points. As you said.
so, what about these trendline structures?
squeeze, etc?