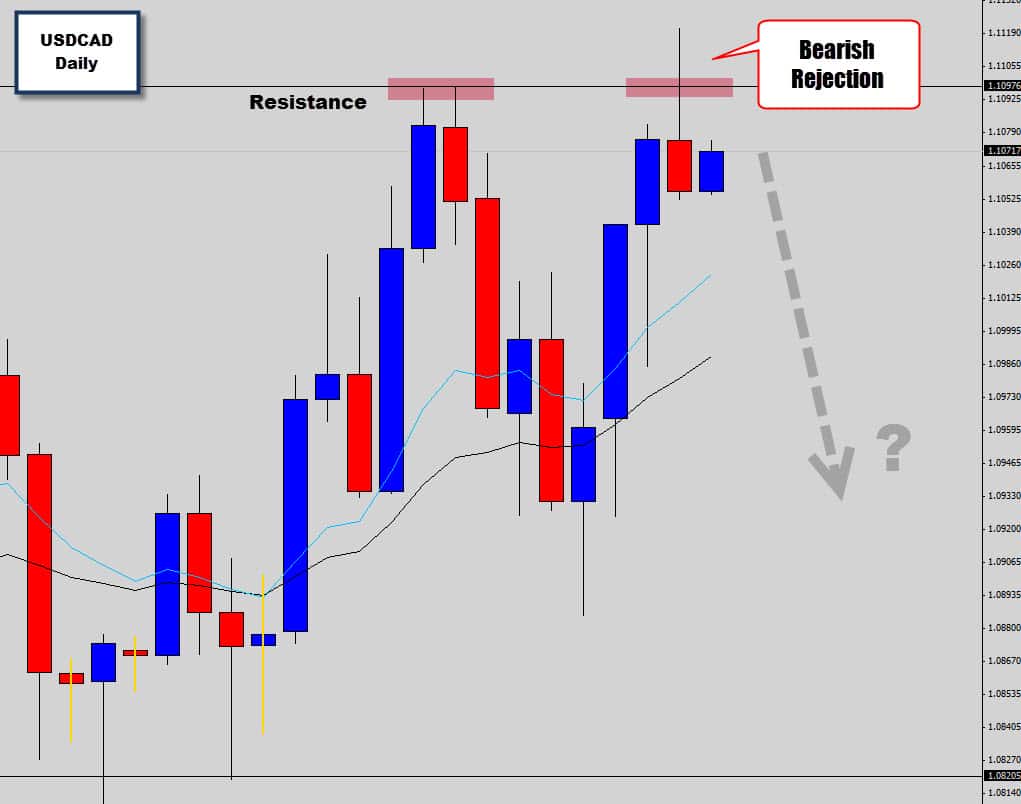
The USDCAD daily chart shows price rallying up into a resistance level which the market failed to move through at the last swing high. When price tested this level last session, all bullish movement was heavily denied as price weakened and close as a bearish rejection candle. The close of the rejection candle was lower than the open price which is something I generally like to see with these bearish setups.
It’s important to note this market is absent of a stable trend and looks like it’s leaning more toward developing into range bound conditions. Retracement entries are valid here, especially the ‘previous high’ retracement entry method we teach in the price action course. If price manages to break the low and confirm the setup, we could see a nice move to the south and a re-test of the weekly support marked on the chart.