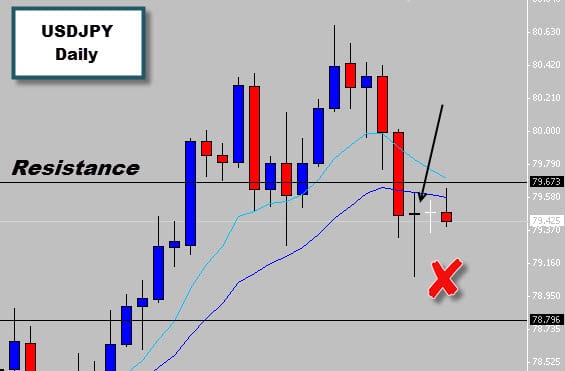
First the recent bearish activity has been very aggressive, this bearish movement is coming straight for a weekly resistance level, which most times act as strong turning points in the market.
Second, there is no trend here – yet. There was bullish market here recently but moment has been exhausted after the price reaction with the weekly level. The new 2nd edition of the Price Action Protocol goes into depth on how to identify the GOOD/BAD market conditions to trade in.
Third reason is, the entire range of the candle formed on the bearish side of the 20EMA, which will no most likely act as dynamic resistance. Its not wise to trade into the 20 EMA because you’re hoping for a breakout.
This rejection candle may trigger off a move into higher prices, but the odds are against us here so lets leave this one to the high-risk traders.