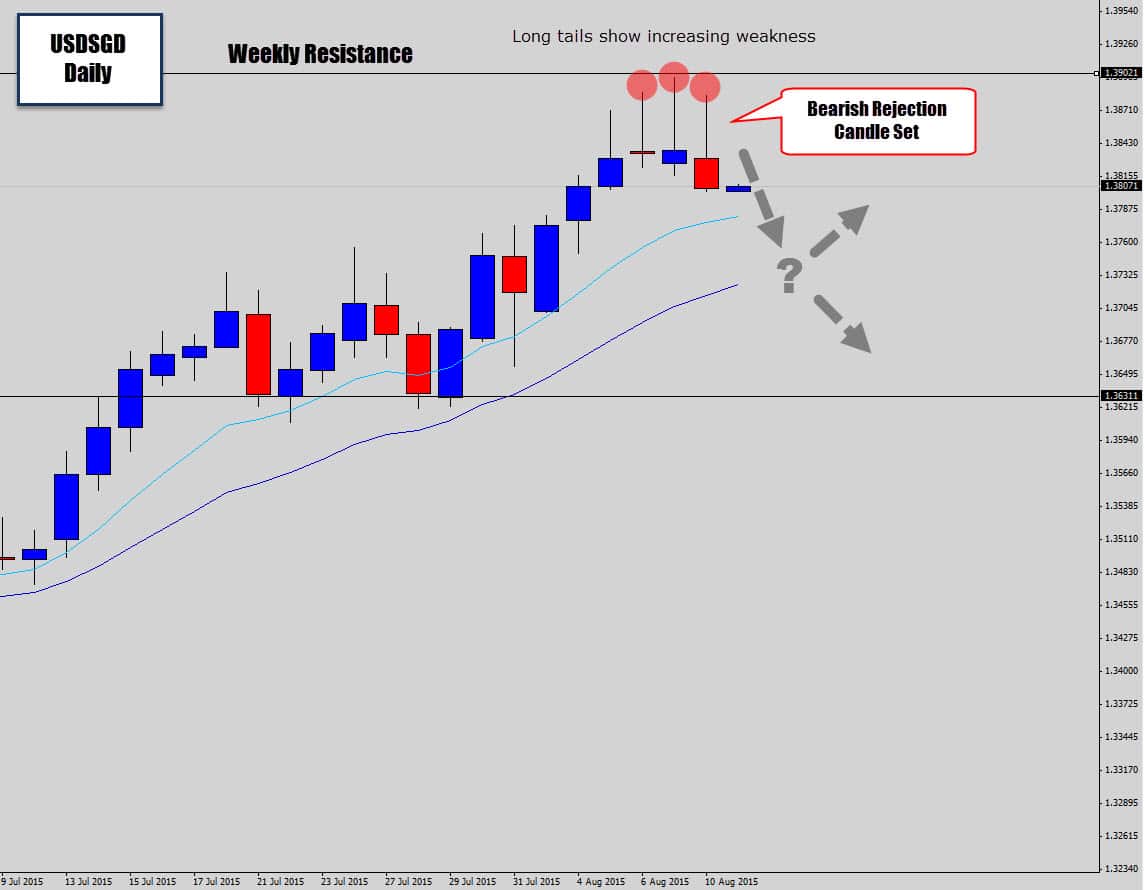
The USDSGD has been in a monster bullish trend this year, but we’ve started to see some signs of temporary slow down. Going into last week’s close, we see two bearish rejection candles, with those upper tails displaying denials of higher prices right around a weekly resistance level.
To usher us into this week’s trading, a third bearish rejection candle formed, with a much more convincing negative close to the body of the candle – signalling further weakness entering the market around the weekly turning point.
Price is elevated from the mean value, so we could definitely see a correctional move back to the mean here. If price does retrace itself back to the mean, the question is, will the mean value hold? or, will price cut through it and continue to head downwards.
We will have to wait and see what the price action does once it reaches this focal point on the daily chart.