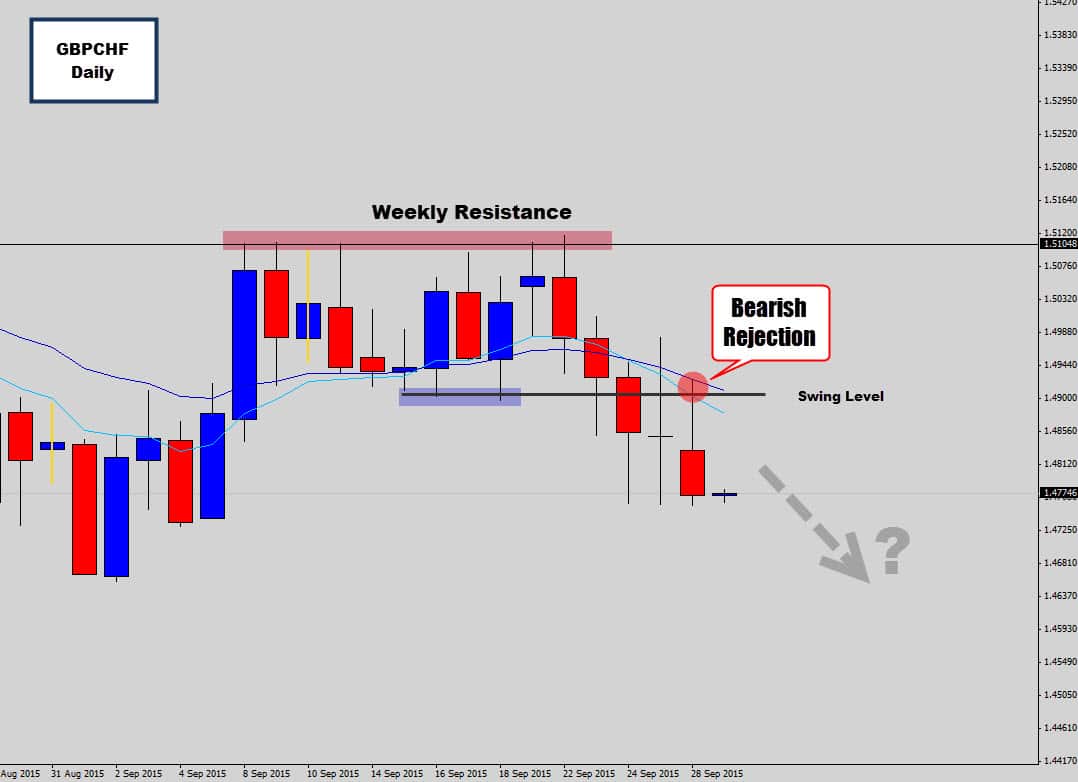
Recently we looked at a few bearish candles coming off weekly resistance here on the GBPCHF daily chart, speculating future weakness.
There was a bit of sideways chop here around this major level, which is to be expected, see latest lesson: How to tell if the market is going into Consolidation.
Now price has broken free of the consolidation structure and pushed into lower lows. The last two sessions we’ve see the market try to rally back higher, but the old consolidation support is holding as new resistance – creating a swing level here.
We’ve also got dynamic resistance here from the mean value and the fact the market is moving down off weekly resistance, this looks like a good bearish swing trade setup.